2020.05.04.8
Files > Volume 5 > Vol 5 No 4 2020
mRNA level of genes related to apoptosis in a colitis model in rats treated with epidermal growth factor

Juan Roca 1*, Hanlet Camacho1, Ana Aguilera1, Isabel Guillen, Yuneisy Delgado, Yiliam Bermudez, Dania Bacardí, José Suarez Alba, Daniel Palenzuela.
Available from: http://dx.doi.org/10.21931/RB/2020.05.04.8
ABSTRACT
The deregulation of cell death pathways in intestinal epithelial cells could involve the pathogenesis of Inflammatory Bowel Diseases. An increase in apoptosis has been observed in patients who have Ulcerative Colitis. Previous experiments have demonstrated the efficacy of EGF in the healing of ulcerative Colitis and other gastrointestinal mucosa lesions. However, there are not many reports on the molecular characterization of EGF's positive effect on the gastrointestinal mucosa. This work aims to deepen the transcriptional changes induced by EGF in the intestinal epithelium in a colitis model in rats. Samples from the distal colon of an EGF-treated colitis model were collect, followed by an analysis by quantitative PCR of the mRNA of 23 genes related to apoptosis. 57% of the genes analyzed presented statistically significant changes in their mRNA level. Of these, two anti-apoptotic genes increased their mRNA level, while the genes that decreased their mRNA level were pro-apoptotic genes and genes related to the TNFα signal transmission path. Changes in the transcription profile of the genes analyzed could suggest a reduction of apoptosis, which could favor the integrity of the Intestinal Epithelium
keywords: animal model, apoptosis, epidermal growth factor, mRNA level, qPCR, Ulcerative Colitis.
INTRODUCTION
Inflammatory bowel disease (IBD) is a term that includes two primary forms of the chronic inflammatory intestinal disorder: Crohn's Disease (CD) and Ulcerative Colitis (UC), both of these with prevalence and incidence rates increasing worldwide.1 IBD is considered a multifactorial disease whose pathogenesis is not fully deciphered. Some hypotheses propose that they result from a deregulation of the intestinal barrier, followed by a pathological activation of the Immune System, leading to chronic inflammation and oxidative stress (OS) of the colon mucosa.2
The intestinal epithelium (IE) acts as a physical barrier that prevents microorganisms' passage to the lamina propria.3 The IE is continuously being renewed, and its integrity is conditioned by a balance between the formation of new intestinal epithelial cells (IEC) and senescent IEC's death. On the one hand, the intestinal stem cells (ISC) resident in the crypt of the intestinal epithelium proliferate and differentiate, giving rise to the adult cells that make up the IE, and at the same time, there is cell death and detachment of the IEC that occurs predominantly at the tip of the villi in the Small Intestine or on the luminal surface of the Large Intestine .4
An increase in cell death in the IE is sufficient to cause intestinal inflammation in the animal model, suggesting that deregulation of cell death pathways in IEC might be involved in IBD's pathogenesis. 5,6 In correspondence with this hypothesis, many apoptotic bodies have been found in biopsies taken from patients suffering from active UC.7
In mammalian cells, apoptosis is activated by two pathways, intrinsic or mitochondrial and extrinsic or receptor-mediated.8,9
Proteins of the BcL2 family control the mitochondrial pathway. There are 2 groups of genes within this family. The pro-apoptotic proteins promote apoptogenic factors, such as cytochrome C protein, from the intermembrane space of the mitochondrion into the cytoplasm, triggering apoptosis. The anti-apoptotic proteins block the release of cytochrome C, avoiding apoptosis.8
Cell death receptors mediate the external pathway. One of the best-studied models is the TNFR1 (TNFα receptor 1); the receptor's union with its ligand initiates a signaling pathway that can lead to inflammation or apoptosis. This route begins with the recruitment of TRADD (TNF Receptor –associated death domain) and RIPK1 (Interacting Kinase Receptor 1) adapter proteins, which form a membrane-bound complex. CIAPs 1 and 2 (cellular inhibitor of apoptosis1 and 2) and TRAF2 or 5 (TNF receptor-associated factor 2 or 5) proteins bind to this complex and polyubiquitinate RIPK1, forming the Complex I that activates the NFKB transcriptional factor, which leads to inflammation and survival. On the contrary, TNFAIP3 (Tumor necrosis factor-alpha-induced protein 3, also known as A20) and CYLD (Cylindromatosis) remove the RIPK ubiquitin tail. The non-ubiquitinate RPK1 bind to FADD (Fas-associated death domain) and procaspase 8, forming complex II that promotes the activation of apoptosis.9,10
Epidermal Growth Factor (EGF) in enemas has been used successfully in the treatment of distal UC. The healing effect of the EGF in gastrointestinal lesions by oral route has also been demonstrated, but in none of the cases the molecular characterization of the effects of the EGF in the gastrointestinal mucosa has been deepened, and the mechanism that mediates these positive effects of the EGF in UC is not fully clarified.11,12
To explore the mechanism of action of the healing effect of EGF in UC, the transcription profile of 23 genes related to apoptosis was evaluated in a dextran sulfate sodium salt (DSS) induced colitis animal model treated with human recombinant Epidermal Growth Factor (hrEGF) in a pellet formulation (patent: EP2533758B1).
Although gene expression can be controlled at various levels, it is widely accepted that it generally happens in DNA transcription, and evidence of the degree of a gene's transcription can be observed by measuring the quantity of messenger RNA corresponding to the gene's DNA.13,14 To study gene transcription variation, real-time PCR is routinely used in molecular biology to amplify products transcribed from messenger RNA. Quantification of such variation may be relative (based on target gene transcription relative to that of a reference gene (RG)) or absolute (based on an internal or external calibration curve). With relative quantification, RNA transcription change is shown as the factor of regulation between two sample groups using normalization. This process compares the degree of transcription of the genes being studied with two or more RG that have unchanging transcription levels, regardless of cell type and treatment being investigated.15
MATERIALS AND METHOD
Experimental design
The bio model of DSS-induced Colitis in rats was performed as reported in the literature, following the recommendations implemented in the guide for the use and care of laboratory animals.16,17 Briefly, the experiment consisted of 2 phases. In the first phase, Colitis was induced in all groups (except group I), by administering 8% DSS in drinking water, ad libitum. In a second phase, the DSS administration was interrupted, and the treatment was applied orally with pellet-placebo or pellet-hrEGF in different doses, depending on the group. Biopsies for histopathological evaluation were taken after 5 days of DSS administration in group II and its control group (group I). In groups III, IV, V, and VI treated with pellet-rhEGF or pellet-placebo, samples were taken after 7 days of treatment. Additionally, in treated groups, samples for RNA extraction were also collected.
Male Wistar rats weighing approximately 300-400gr were used. Animals were randomly assigned to the following experimental groups:
Group I: Healthy animals. Five animals were sacrificed on day 6 to obtain excisional biopsies of the distal colon.
Group II: Bio model of colitis induced with 8% DSS for 6 days. Untreated animals, 5 animals were sacrificed on day 6 to obtain distal colon's excisional biopsies.
Group III: Bio model of colitis induced with 8% DSS for 6 days. Afterward, animals were treated with pellet-vehicle for 7 days; 5 animals were sacrificed on day 14 to obtain distal colon's excisional biopsies.
Group IV: Bio model of colitis induced with 8% DSS for 6 days. Afterward, animals were treated with pellet-hrEGF 125 μg / capsule / day was administered for 7 days and 5 animals were sacrificed on day 14 to obtain distal colon's excisional biopsies.
Group V: Bio model of colitis induced with 8% DSS for 6 days. Afterward, animals were treated with hrEGF 250 μg / capsule/day was administered for 7 days, and 5 animals were sacrificed on day 14 to obtain distal colon's excisional biopsies.
Group VI: Bio model of colitis induced with 8% DSS for 6 days. Afterward, animals were treated with- hrEGF 500 μg / capsule/day was administered for 7 days, and 5 animals were sacrificed on day 14 to obtain distal colon's excisional biopsies.
RNA extraction
Colon biopsies for RNA extraction were stored in AmbionRNAlater (AppliedBiosystems, USA) at −20°C until used. Fragments of approximately 30 mg of colon samples were processed in the Tissue Lyser equipment (Qiagen, Hilden, Germany), and the total RNA was purified with the RNeasy® Plus reagent kit (QIAGEN GmbH, Germany) using the Qiacube platform. RNA performance and quality were determined with the NanoDrop spectrophotometer (NanoDrop Technologies, USA) and the Bioanalyzer Bioanalyzer (Agilent, 2100, USA).
Synthesis of the complementary DNA chain
The complementary DNA (cDNA) chain was synthesized from 1 µg of total RNA, using the Superscript III First-Strand Synthesis Supermix for RT-PCR reagent kit (Invitrogen Technologies, Carlsbad, California, USA), according to manufacturer instructions.
A) Verification of the absence of genomic DNA (gDNA) in the cDNAs by quantitative PCR (qPCR)
Two reactions were performed: one using the cDNAs, diluted 1:10, and the other one with the corresponding RNAs diluted to an equivalent concentration. The same reaction conditions were followed in 20 µL as described in the qPCR section. The primers used in this case amplify a segment of the gene that encodes the protein Catalase (CAT) (table1). Two technical replicas were used for each condition (RNA or cDNA) in each sample. The difference between the Ct (ΔCt), from the average Ct of the RNAs amplification replicates, and the average Ct of the cDNAs amplification replicates were calculated.
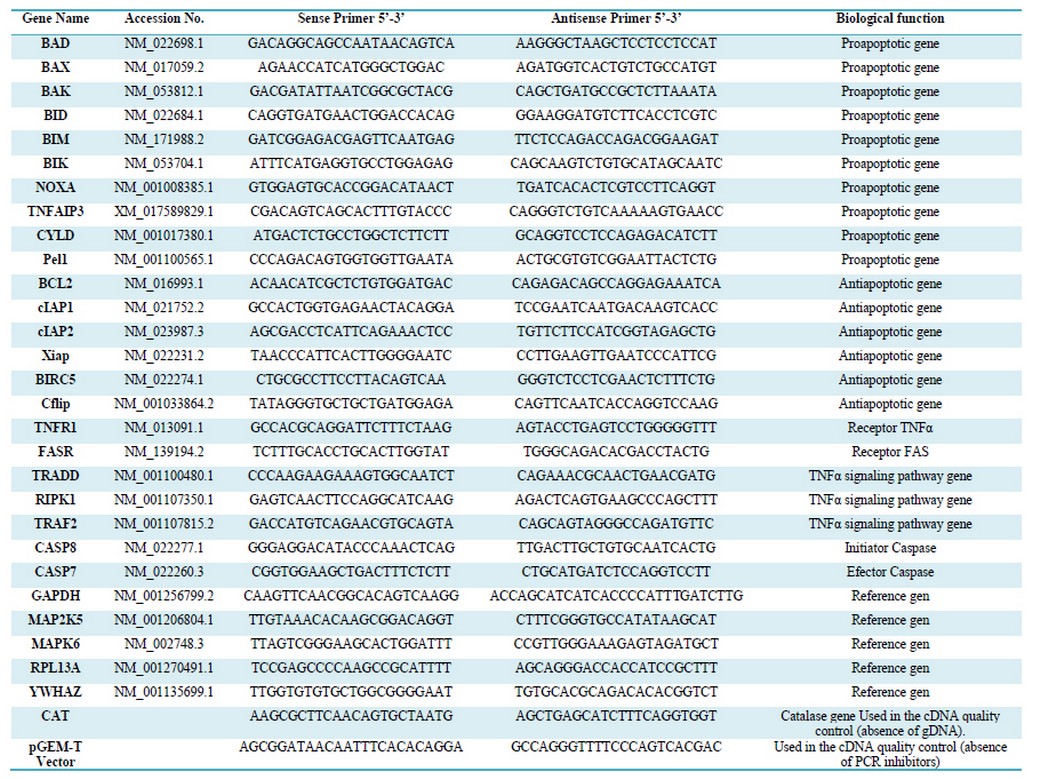
Table 1. Sequence of primers used in the qPCR analysis
B) Verification by qPCR of the absence of inhibitors in the cDNAs
The qPCRs were performed for the amplification of a calibrator (pGEM-T Vector), using specific primers. The reaction was prepared in a final volume of 20 µL, with 2 µL of cDNA(1:25) or H2O, and 18 µL of a mix, containg10 µL of LightCycler 480 SYBR Green I Master 2x, 8 µL of pGEM-T Vector primer mix(300nM final concentration) and pGEM®-T Vector (2,56 x10³ copies per reaction). Negative control reactions were prepared in the same condition, but without adding the pGEM-T Vector.
qPCR and Bioinformatic tool
The Primer3 website application was used to design the qPCR primers with a size of 22 bases, TM= 62 oC, and an average G + C content of 50% (Table 1).18
To determine the RG, the geNorm program was used.19 The housekeeping genes (HSKG) evaluated were: PPIA, MAPK6, MAP2k5, GAPDH YWHAZ, and RPL13A
. The LingReg program (version 11.3, 2009, Amsterdam, Netherlands) was used to estimate the efficiency of qPCR
The qPCR reactions were prepared in a volume of 20 µl, containing 10 µl of the PCR TM Absolute QPCR SYBR Green (Thermo Scientific), 6 µl of primers (70 nM), and 4 µl of cDNA (diluted in a factor of 25).
The reactions were incubated at 95 ° C for 15 min, followed by 40 cycles of 95 ° C for 15 s, 60 ° C for 30 s and 72 ° C for 30 s. On the CapitalBio RT-Cycler001 equipment (CapitalBio Co., Ltd., Beijing, China) and qPCR data analysis was performed using the CapitalBio RT-Cycler Version 2.001 program (CapitalBio Co., Ltd., Beijing, China).
In all cases, qPCR used 3 technical replicas for each biological replica. A total of 23 genes related to apoptosis were evaluated. (Table 1)
The mRNA transcription ratios were calculated using the statistical model "Pair Wise Fixed Reallocation Randomisation Test" implemented in the REST software 2009 v2.0.13 program (Qiagen GmbH, Germany), according to a report by PtaffI et al.; in 2002. For up-regulation, the factor of regulation is equal to the given value in the Randomisation results. In the case of down-regulation, the regulation factor is illustrated as (-1/factor of regulation). Statistically significant changes were considered those associated with a p-value of less than 0.05.15
RESULTS AND DISCUSSIONS
Characterization of DSS-induced Colitis in rats and the histological improvement induced by rhEGF treatment
During treatment with 8% DSS, rats in all groups, except those in group I (colitis control group), experienced clinical signs indicating the presence of Colitis such as diarrhea, rectal bleeding, and weight loss (manuscript in preparation).
After sacrificing the animals, the total histopathological score(THS) of mucosa damage was calculated, as previously described, to confirm that the colitis model was established and secondly: the effect of Pellet-rhEGF on the colonic IE. 20
When comparing THS between group II vs group I, an increase in histological damage was detected, confirming the colitis model's reproduction, comparing groups IV, V, and VI (treated with different doses of rhEGF) vs. group III (treated with placebo), shows the effect of rhEGF, at different doses, on the colon mucosa damage. Group IV (dose of 125μg / capsule/day) did not present significant THS differences concerning group III. However, Groups V and VI (doses of 250 and 500 μg / capsule/day, respectively) did show a significant decrease in histological damage, concerning group III, indicating an improvement of the colon mucosa damage. Additionally, no significant differences were observed between the doses of 250 and 500 μg / capsule/day; therefore, both groups were united to determine the differential transcription profile of genes between the treated group responding to pellet-rhEGF vs. the placebo group.21
Diferential transcription study
Differential transcription studies by qPCR require a rigorous control in each step of the process, such as the Quality Control of the extracted RNA sand of the synthesized cDNAs, as well as a normalization of the qPCR with RG that ensures that the variation of the levels of mRNA found to respond to real variations in transcription induced by EGF and are not artifacts due to errors made in the workflow. The results of each of these controls are described below:
Quality Control of total RNA purified from distal colon samples
The concentration obtained was in all RNAs greater than 100 ng / µL. The OD 260/280 ratio (protein contamination) was within the established parameters (1.7-2.2). The samples' quality was also examined by microcapillary electrophoresis, whose program established by the Agilent company includes the calculation of the RNA integrity number (RIN). A RIN value greater than 7 was obtained in all RNAs, indicating that they can be used in a qPCR.22 (table 2, fig.1 supplementary)
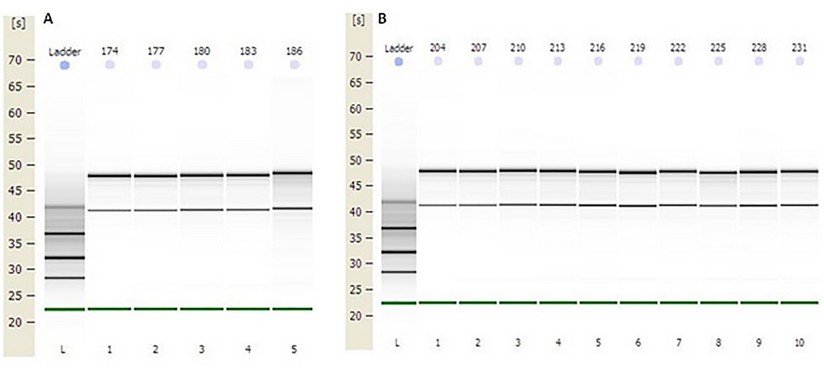
Figure1. Capillary electrophoresis of total RNA obtained from distal colon tissue. First lane: molecular weight standard (MW ladder). The remaining lanes show the bands corresponding to the 28S and 18S rRNA subunits (retention times of 48 s and 43 s, approximately) of the total RNA of the samples. A) Total RNA from samples: 174, 177, 180, 183, and 186 (Group III). B) Total RNA from samples: 204, 207, 210, 213, 216, 219, 222, 225, 228 and 231 (Groups V and VI).
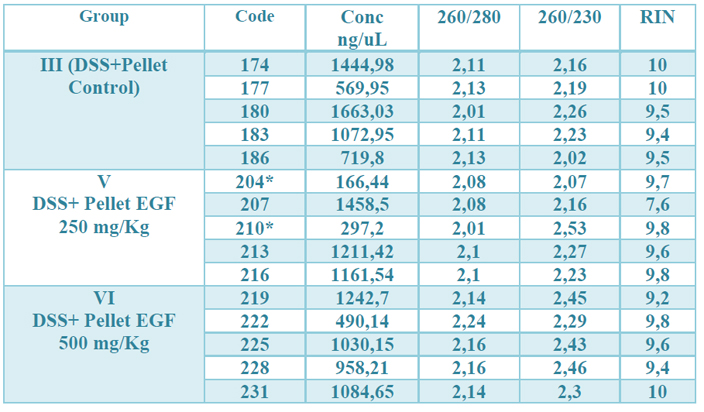
Table 2. Results of the quality control of the total RNA extraction. The observed values correspond, from left to right, to: identification number of the samples, the concentration in ng / µL, the OD 260/280, 260/230 ratio and the RIN value (RNA integrity) of each one. of the samples. * means that for their total amount of RNA, they were depleted in previous studies.
Quality control of cDNA obtained from total RNAs
To standardize qPCR's initial conditions, it is necessary to determine several parameters such as the absence of gDNA and qPCR inhibitors in the synthesized cDNAs.
A) Verification of absence of gDNA in samples of complementary DNA by qPCR
To verify that the cDNAs met this condition, qPCRs were performed with both RNAs extractions and their corresponding cDNAs, using a set of primers that amplifies a segment of CAT gene. Hybridization of these primers in the same exon of CAT gene makes it possible to efficiently amplify the gene, both in the cDNA samples and the contaminating gDNA, if it exists, obtaining in both cases a product with the same amplification profile. The modular value of the ΔCt was more than 7 in all cases, which ensures that the gDNA if it exists, will not interfere with the Qpcr.23 (table 3, supplementary).
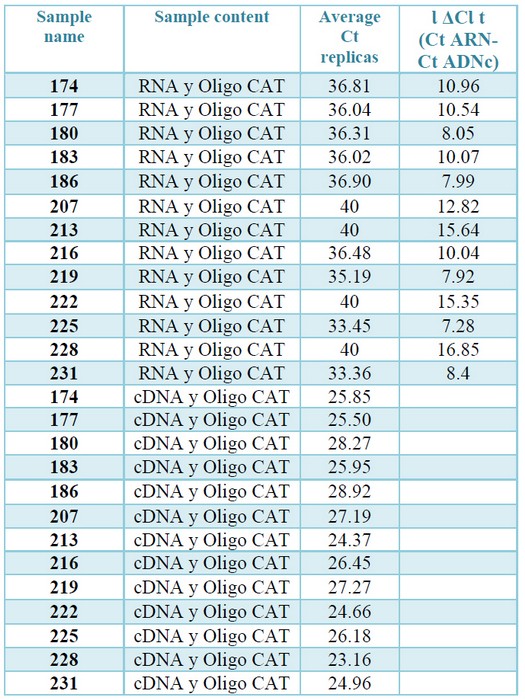
Table 3. Check for absence of gDNA by qPCR. The Ct values correspond to the amplification from the cDNA or from the total RNAs (diluted to a concentration equivalent to that present in the cDNAs) of each sample. The ΔCt are the difference between the average Ct obtained from the replications of the reactions prepared with RNA and the average Ct resulting from the
replications of the reactions prepared with RNA with the corresponding cDNAs.
B) Verification by qPCR of the absence of inhibitors in the cDNAs
To verify the absence of inhibitors in the cDNA samples, qPCRs were performed using a calibrator. The amplification of this calibrator is produced with high efficiency and reproducibility of the Ct values. Therefore, a decrease in the qPCR Ct of the calibrator "contaminated" with cDNA would indicate inhibitors' presence.
The modular value of ΔCt of the reactions containing cDNA (amplification reaction of the pGEM®-T Vector "contaminated" with cDNA) and those containing H2O (amplification reaction of the pGEM®-T Vector "not contaminated") is less than 1 in all cases (table 4, supplementary). Therefore, it can be stated that there is no presence of inhibitors in any of the analyzed cDNAs.23
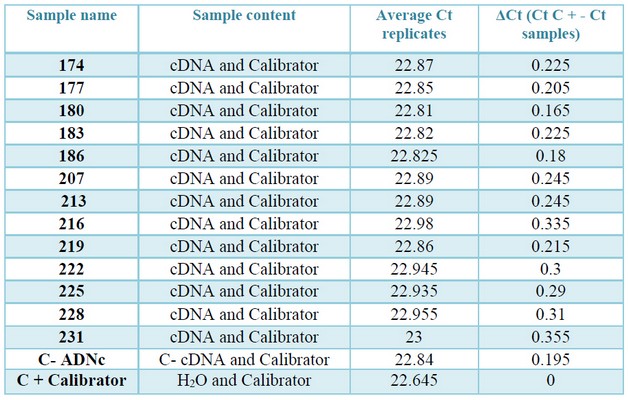
Table 4. Values of Ct and ΔCt, obtained in the check of inhibitors by qPCR. In column three: the average Ct values of the positive control "contaminated" with the samples and the calibrator. In column four: Modular value of the difference in average Ct of the positive control and the control "contaminated" with the cDNAs (ΔCt = Ɩ (Ct (calibrator) -Ct (calibrator cDNA) Ɩ).
Selection of RG
The mean expression stability values (M) of an RG must be less than 1.5 for its expression could be considered stable.19 The six HKGs evaluated showed M values less than 0.78. The 3 most stable genes (GAPDH, MAPK6, and MAP2K5) were selected as RGs.16 (fig. 2 supplementary)
Figure 2. Graphic of the stability analysis in the expression of the HKGs. The most stable genes are located to the right
Transcription profile
As explained in materials and methods, the mRNA transcription ratios were calculated using the statistical model "Pair Wise Fixed Reallocation Randomisation Test" implemented in REST software. REST© allows a comparison of target genes with reference genes in two experimental groups. Relative quantification of a target transcript is based on the mean CP deviation of control and sample group, normalized by a reference transcript.
The Randomisation test is a useful alternative to standard parametric tests for analyzing the experimental data. It's results allow us to determine if the specific mRNA in the sample group in comparison with the control group is up- or down-regulated and illustrates the factor of regulation and if this up- or down-regulation is significantly different or not. 24
In the comparison of transcription profile found in EGF treated rats that respond to EGF (Group V + VI) vs. vehicle (group III), the following change was observed:
Eight pro-apoptotic genes showed a statistically significant decrease in mRNA level including, both those related to mitochondrial apoptosis: BAD (Bcl2-associated death promoter), BAX (Bcl2-associated X protein), BAK (BCL2-antagonist / killer 1), BCL211 (BCL2 like 11, also known as BIM), BID (BH3 interacting domain death agonist,), NOXA (NADPH oxidase activator), as with external apoptosis: TNFAIP3 and CYLD (fig.3).

Figure 3. mRNA regulation factor in colon biopsies of apoptosis related genes evaluated by qPCR. Data are represented as regulation factor of mRNA level of animal model treated with pellet-hrEGF vs animal model treated with pellets-placebo (normalized with the selected RGs), obtained with a Pair Wise Fixed Reallocation Randomization Test implemented in REST software 2009 v2.0.13 (Qiagen GmbH, Germany). For up-regulation, the factor of regulation is equal to the given value in the Randomization results. In the case of down-regulation, the regulation factor is illustrated as (-1/factor of regulation). * mean statistically significant variations in mRNA levels.
The balance between pro-apoptotic and anti-apoptotic proteins is what determines whether mitochondrial apoptosis occurs or not. The decrease mRNA level of 7 pro-apoptotic genes of mitochondrial apoptosis might suggest a shift in the balance of apoptosis regulation, favoring the decrease in mitochondrial apoptosis .25,26
The RPK1 protein acts at a crossing point of the apoptosis or inflammation pathways. Its degree of ubiquitination determines whether inflammation or apoptosis takes place. The non-ubiquitinate form induces apoptosis9,10. Therefore, a decrease in mRNA level of TNFAIP3 and CYLD genes that code for enzymes that remove the ubiquitin tail from RIPK1 suggests a decrease in external apoptosis. Likewise, the statistically significant decrease of the TNFR1 and RPK1 genes involved in the transmission of the TNFα signal argue for a decrease in both inflammation and external apoptosis.
The significant increase of the mRNA level of XIAP (X-linked apoptosis inhibitor) and BIRC5 (baculoviral inhibitor of repeat-containing apoptosis 5, also known as survivin), could also contribute to a reduction of apoptosis. Proteins codes by these anti-apoptotic genes can inhibit the catalytic activity of the effector caspases 3, 7 and the initiator caspase 9 (fig. 3).27,28
Healing of the intestinal mucosa is a marker of remission and a predictor of long-term positive IBD results.29 Despite this, medications currently approved for the treatment of IBD can inhibit the repair of the IE ulcers.30 The development of biological therapies such as growth factors that accelerate the healing process of ulcers of the intestinal epithelium, then constitute an attractive therapeutic objective. On the other hand, growth factors have been associated with cancer, and this has caused concern that its use could increase the risk of Colitis associated cancer(CAC), which has limited the progress of UC therapy with the EGF.31 It is also reported that decreased apoptosis is an essential mechanism in carcinogenesis and the cancer resistance to chemotherapy.32
However, the main mechanism that links inflammation to preneoplastic genetic alterations is the chronic OS, which constitutes a constant danger of damage to the IE, causing mutations in DNA as well as damage to cellular proteins and lipids .33 Consequently, it has been shown that direct or indirect inhibition of OS avoid DNA damage and decreases the development of intestinal tumors.34
A group of genes associated with the development of CAC, such as cytokines: IL-6, IL-1b, TNFα, and transcription factors NFKB and STAT3, are reported.34 Our group has recently reported that these genes, as well as other genes associated with inflammation and OS, significantly decrease their transcription in colon biopsies of this colitis model treated with hrEGF.21 Therefore, a decrease in IEC apoptosis, far from assuming an increased risk of CAC, could reduce this cancer risk. This is consistent with other studies in animals that indicate that activating the EGF pathway could reduce CAC's long-term risk in UC35. All these changes in the transcription profile of the analyzed genes could suggest a decrease of apoptosis in the IEC, which could favor IE's integrity and, therefore, reduce inflammation, supporting the use of EGF for the treatment of UC in its initial stage. (Fig. 4)
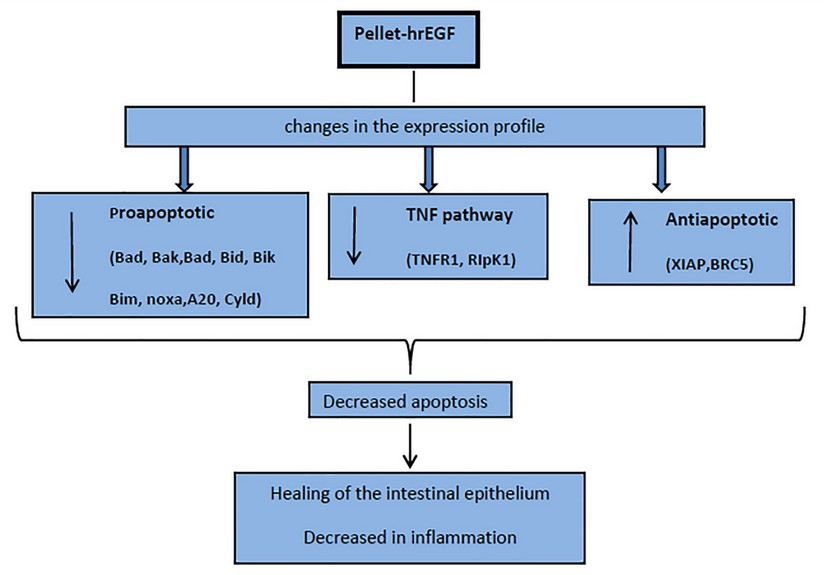
Figure 4. Scheme on the effect in apoptosis of hrEGF in the treatment of ulcerative Colitis in an induced model in rats with DSS.
Despite these results observed in a model of Colitis in rats, for the use in humans of therapies of this type, it would always be necessary to deepen the question of drug biosecurity.
A limitation of this gene transcription analysis in this study in experimental Colitis is that at the moment, the results of proteomics studies that support these results are not available. Despite this, our results constitute a snapshot of the EGF-induced transcriptional activity in genes related to apoptosis.
CONCLUSION
In this colitis model in rats, hrEGF induces the IEC a decrease in the mRNA level of pro-apoptotic genes and an increase in the mRNA level of anti-apoptotic genes. This could reduce apoptosis in the intestinal epithelium, favoring the healing of typical colitis ulcers. The previous mechanism could at least partly explain the previous reports of the positive effect of EGF in ulcerative colitis therapy.
REFERENCES
1. M'Koma AE. Inflammatory Bowel Disease: An Expanding Global Health Problem. Clinical Medicine Insights: Gastroenterology 2013, vol6: 33–47. DOI: 10.4137/CGast.S12731
2. Katsanos KH and Papadakis A. Inflammatory Bowel Disease: Updates on Molecular Targets for Biologics. Gut and Liver. 2017, Vol. 11(4): 455-463. https://doi.org/10.5009/gnl16308
3. Okamoto, R. and Watanabe, M. Role of epithelial cells in the pathogenesis and treatment of inflammatory bowel disease. J Gastroenterol (2016) 51(1): 11-21. DOI 10.1007/s00535-015-1098-4.2)
4. Van der Flier LG and Clevers H. Stem Cells, Self-Renewal, and Differentiation in the Intestinal Epithelium. Annu. Rev. Physiol. 2009. 71:241–60. DOI: 0.1146/annurev.physiol.010908.163145
5. Delgado ME, Grabinger T and Brunner T. Cell death at the intestinal epithelial front line. FEBS Journal 2016 vol 283: 2701–2719. doi:10.1111/febs.13575
6. Blander JM: Death in the intestinal epithelium-basic biology and implications for inflammatory bowel disease. The FEBS Journal, 2016, vol 283: 2720–2730. doi:10.1111/fe bs.13771
7. Hagiwara C, Tanaka M, and Kudo H, "Increase in colorectal epithelial apoptotic cells in patients with ulcerative colitis ultimately requiring surgery," Journal of Gastroenterology and Hepatology, 2002, vol. 17 (7): 758–764.
8. Duprez L, Wirawan E, Vanden Berghe T and Vandenabeele P. Major cell death pathways at a glance. Microbes and Infection 2009, vol 11: 1050-1062. doi:10.1016/j.micinf.2009.08.013
9. Declercq W, Vanden Berghe T and Vandenabeele P." RIP Kinases at the Crossroads of Cell Death and Survival ". Cell 2009. Vol 138:229-232. DOI 10.1016/j.cell.2009.07.006
10. Vanden Berghe T, Kaiser WJ, Bertrand MJM, and Vandenabeele P. Molecular crosstalk between apoptosis,necroptosis, and survival signaling.Molecular & Cellular Oncology. 2015. Vol 2(4): e975093-1- e975093-12. http://dx.doi.org/10.4161/23723556.2014.975093
11. Atul Sinha A, Nightingale J, West KP, Berlanga J and Playford RJ. "Epidermal Growth Factor Enemas with Oral Mesalamine for Mild-to-Moderate Left-Sided Ulcerative Colitis or Proctitis". Engl J Med 2003; 349:350-357
12. Kuwahara Y, Sunagawa Y, Imoto Y and Okabe S. "Effects of Orally Administered Human Epidermal Growth Factor on Natural and Delayed Healing of Acetic Acid-Induced Gastric Ulcers in Rats". The Japanese Journal of Pharmacology. 1990; 52(1): 164-166
13. Lodish H, Berk A, Matsudaira P, Kaiser C. Molecular Cell Biology. 5th ed. New York: W. H.Freeman; 2003 Aug 1. 973 p.
14. Berg JM, Tymoczko JL, Stryer L. Biochemistry. 5th ed. New York: W. H. Freeman; 2002 Feb 15.1100 p.
15. Michael W. Pfaffl, Graham W. Horgan, Leo Dempfle. Relative expression software tool (REST©) for group-wise comparison and statistical analysis of relative expression results in real-time PCR. Nucleic Acids Research. 2002, Volume 30, Issue 9. https://doi.org/10.1093/nar/30.9.e36
16. Solomon L, Mansor S,Mallon P, Donnelly E, Hoper M, Loughrey M, et al. "The dextran sulphate sodium (DSS) model of colitis: an overview". Comp Clin Pathol.2010; 19:235–9.DOI 10.1007/s00580-010-0979-4.
17. Programa para el Uso y Manejo del Animal de Laboratorio con fines Experimentales y para el Control de Productos Biotecnológicos del Centro de Ingeniería Genética y Biotecnología de la Habana, Cuba. 2016.
18. Rozen S, Skaletsky HJ. "Primer3". 1998; Code available at http://www-genome.wi.mit.edu/genome_software/other/primer3.htm
19. Vandesompele J, De Preter K, Pattyn F, Pope B, Van Roy N, De Paepe et al. "Accurate normalization of real-time quantitative RT-PCR data by geometric averaging of multiple internal control genes". Genome Biologt. 2002; vol3(7): 0034.1-11.
20. FitzGerald AJ, Puc M, Marchbank T, Westley BR, Mayc FEB, Boyle J, et al. "Synergistic effects of systemic trefoil factor family 1 (TFF1) peptide and epidermal growth factor in a rat model of colitis". Peptides 25.2004, vol2004: 793–801. DOI:10.1016/j.peptides.2003.12.022
21. Roca J, Camacho H, Guillen IA, Aguilera A, Bermudez Y, Palenzuela DO, et al. Pharmacogenomic study of EGF treatment in a rat DSS-induced colitis animal model. Biotecnol Apl. 2019;vol 36(3):3211.
22. Fleige, S., Pfaffl M.W. (2006). "RNA integrity and the effect on the real-time qRT-PCR performance". Mol Aspects Med, 2006; vol27(2–3),126–39.
23. Bustin, S., Benes, V., Garson, J., Hellemans, J., Huggett, J., Kubista, M., Mueller, R., Nolan, T., Pfaffl, M., Shipley, G., Vandesompele, J. y Wittwer, C. "The MIQE Guidelines: Minimum Information for Publication of Quantitative Real-Time PCR Experiments". Clinical Chemistry. 2009; vol 55(4): 611–622
24. Horgan,G.W. and Rouault,J. Introduction to Randomisation Tests. 2000 Biomathematics and Statistics Scotland.
25. Hengartner, M.O. "Biochemistry of apoptosis" Nature. 2000; vol 407: 770-776. DOI:10.1038/35037710
26. Sharma HP., Jain P. and Amit P." APOPTOSIS (PROGRAMMED CELL DEATH) - A REVIEW". World Journal of Pharmaceutical Research. 2014; vol3(4): 1854-1872.
27. Laurence DD, Dupoux A and Cartier J. IAPS: More than just inhibitors of apoptosis proteins. Cell Cycle. 2008, vol7(8): 1036-1046, DOI: 10.4161/cc.7.8.5783.
28. Owens TW, Gilmore AP, Streuli CH, Foster FM "Inhibitor of Apoptosis Proteins: Promising Targets for Cancer Therapy". J Carcinogene Mutagene 2013;S14: 004. doi:10.4172/2157-2518.S14-004.
29. Neurath, M. F. & Travis, S. P. L. Mucosal healing in inflammatory bowel diseases: a systematic review. Gut 61, 1619–1635 (2012). DOI: 10.1136/gutjnl-2012-302830.
30. Jung, S., Fehr, S., Harder-d'Heureuse, J., Wiedenmann, B. & Dignass, A. U. Corticosteroids impair intestinal epithelial wound repair mechanisms in vitro. Scand. J. Gastroenterol. 36, 963–970 (2001).
31. Garrido JB, Hernández-Calleros J, I García-Juárez I, Yamamoto-Furusho JK." Growth Factors as Treatment for Inflammatory Bowel Disease: A Concise Review of the Evidence Toward Their Potential". The Saudi Journal of Gastroenterology. 2009; vol. 15(3): 208-12. DOI: 10.4103/1319-3767.54742.
32. Chen L, Zeng Y and Zhou SF "Role of Apoptosis in Cancer Resistance to Chemotherapy", 2018. DOI: 10.5772/intechopen.80056
33. Foersch S, Neurath MF." Colitis associated neoplasia: molecular basis and clinical Translation". Cell. Mol. Life Sci. 2014; vol71: 3523–35. DOI 10.1007/s00018-014-1636-x.
34. Ferguson LR. "Chronic inflammation and mutagenesis". Mutat Res 2010; vol 690:3–11. doi:10.1016/j.mrfmmm.2010.03.007
35. Dube PE, Liu CY, Girish N, Washington MK, Polk DB. Pharmacological activation of epidermal growth factor receptor signaling inhibits colitis-associated cancer in mice. Sci Rep. 2018; 8(1):9119
Received: Aug 22 2020
Accepted: Sept 20 2020
Juan Roca 1*, Hanlet Camacho1, Ana Aguilera1, Isabel Guillen, Yuneisy Delgado, Yiliam Bermudez, Dania Bacardí, José Suarez Alba, Daniel Palenzuela.
1: All these authors equally contribute to these results.
*corresponding author: [email protected]
Authors affiliations: Center for Genetic Engineering and Biotechnology
Havana, CUBA