2022.07.01.35
Files > Volume 7 > Vol 7 No 1 2022
Temporal progress of web blight in three common bean genotypes on the central coast of Ecuador

Walter R. Chávez-García 1 , Fiorella N. Mera-Vera 1, Diego Portalanza 2, and Felipe R. Garcés-Fiallos 1,*
1 Technical University of Manabí, Faculty of Agronomic Engineering, Experimental Campus La Teodomira, Km 13,5, Santa Ana, Manabí, Ecuador, Postal code: EC130105; [email protected], [email protected],
2 Federal University of Santa Maria, Department of Physics, Climate Research Group, Av. Roraima, 1000, Santa Maria (RS), Brazil; [email protected]. ORCID:
* Correspondence: [email protected]; Tel.: +593 939929958. Portoviejo, Manabí, Ecuador
Available from: http://dx.doi.org/10.21931/RB/2022.07.01.35
ABSTRACT
Web blight caused by Rhizoctonia solani Kuhn is one of the main common beans (Phaseolus vulgaris L.) diseases of the Ecuadorian central coast. Thus, the present study aimed to evaluate the progress of web blight incidence using nonlinear models in promising genotypes SER 03 and SER 08, using the commercial cultivar INIAP 473 as a control. This study was carried out between the 2010 and 2012 seasons in Quevedo, Ecuador. Epidemiological parameters such as initial disease (y0), disease progress rate (r), final incidence and the area under the disease progress curve were estimated using the Exponential, Logistic, and Gompertz models. In general, progress curves, epidemiological parameters and other evaluated plant health variables were lower in the INIAP 473 cultivar than the other genotypes in 2011 and 2012, especially in the last season when higher y0 and r were observed in the commercial cultivar. It seems that soil and seeds inoculum and temperature play an important role in standard bean crop disease progress. While the response of genotypes and each location conditions influenced the epidemic modeling, the Logistic model better described the web blight progress under these conditions.
Keywords. Phaseolus vulgaris L.; Rhizoctonia solani Kuhn; initial disease; disease progression rate; final incidence
INTRODUCTION
Common bean (Phaseolus vulgaris L.) is a socially important crop in Ecuador and an important legume in the Ecuadorian diet. Currently, the bean area is estimated at 25253 ha with a mean yield1 of 0.61 t ha-1, highlighting the provinces of Los Rios, Imbabura, and Azuay, which have the largest planted area for this crop2. On the central Ecuadorian coast, farmers use native and introduced cultivars3, which are generally susceptible to different biotic-based diseases.
Several diseases affect bean crops on the central Ecuadorian coast, i.e., rust (Uromyces appendiculatus Pers.: Pers.), web blight (Rhizoctonia solani Kuhn), virus infections, and root rot (Fusarium spp., R. solani and Macrophomina phaseolina Tassi)4. Among these diseases, the one that most predominates over the rest is the web blight, both in monoculture and association systems5,6. In general, the disease may be observed affecting bean crops established each year in the north of Los Ríos province, reaching a severity of 88% in susceptible genotypes7. Web blight considerably reduces the number of nodes, pods, and grains per plant and the grain yield4,7. Another predominant factor is the association between web blight and root rot, caused by R. solani3. Diseases management in commercial cultivars and landrace bean genotypes established in this part of Ecuador is usually through fungicides3.
Although there is currently valuable information about the web blight intensity in promising bean genotypes, obtained from different experiments established on the central Ecuadorian coast during some years, no epidemiological studies have been carried out in this pathosystem. From an epidemiological point of view, an epidemic may or may not generate sufficient levels of damage to cause economic loss in an agro-productive system8. Different linear and nonlinear mathematical models can be used to describe the development of epidemics, i.e., Exponential, Monomolecular, and Logistic, with polycyclic diseases being able to be described using the Logistic model and monocyclic diseases using the Monomolecular model9.
The parameters used are the initial disease, the apparent disease increase rate, and the maximum disease level10. In any case, not all disease progress curves are well or quickly described using a growth curve model, and alternative methods such as the Area Under the Disease Progress Curve (AUDPC) can also be used, which allow quantitative resistance to disease assessment11. Mathematical growth models can summarize, in the form of relatively simple mathematical expressions, the relationship between disease and time, having practical importance, or simply contributing to a better understanding of the disease’s infectious progression12.
A web blight epidemiological study under natural conditions in different bean genotypes and seasons in a row can expose valuable information that will help select efficient disease management strategies for this legume. Therefore, in the present work, epidemiological parameters of web blight such as the quantity of initial inoculum and the progress rate were compared, using the Exponential, Logistic and Gompertz models, in the promising genotypes SER 03 and SER 08, using the commercial cultivar INIAP 473 as a control between 2010 and 2012, in Quevedo, Los Ríos province, Ecuador.
MATERIALS AND METHODS
Study Area
Field experiment was carried out at La María Experimental Farm (79° 30' 08'' W and 0° 00' 35'' S) between 2010 and 2011 (Experiments 1 and 2), and at Hacienda Florencia (79° 50' 86” W and 01° 06' 84” S) in 2012 (Experiment 3). Both locations are in Quevedo, Los Ríos province, Ecuador, characterized by having conditions of humid tropical forest (bh-T), with uniform topography, clay loam type Inceptisol soil, and pH 5.7. The mean air temperature and rain precipitation of these experiments are shown in Figure 1. Meteorological data from Client for ‘NASA' ‘POWER’ global meteorology, surface solar energy and climatology data’ API’. ‘POWER’ (Prediction Of Worldwide Energy Resource) freely available for download with a spatial resolution of 0.5 x 0.625 degree latitude and longitude for meteorology were used as observed data.
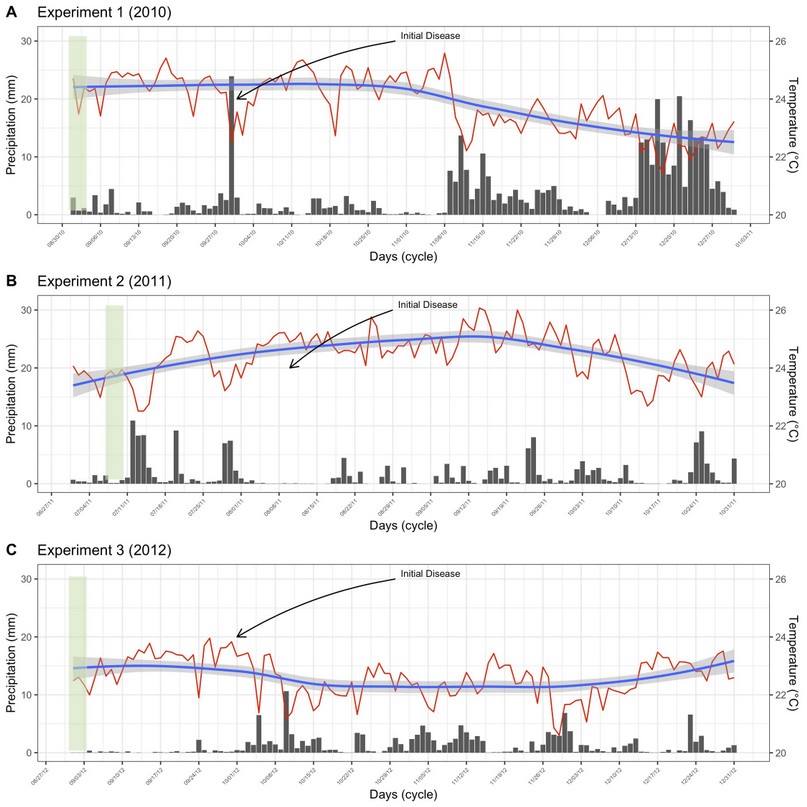
Figure 1. Daily variation of meteorological variables throughout the experimental crop cycle. Mean air temperature (ºC, red lines), and pluvial precipitation (mm, black bars) for experiments 1 (A), 2 (B), and 3 (C). The blue lines represent the smoothed tendency of air temperature, and the light gray represents the confidence interval of the data.
Genetic material
Three Ecuadorian common bean genotypes, two promising lines, and a commercial cultivar were used to control (Table 1).
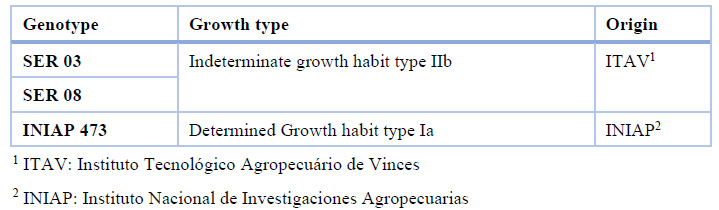
Table 1. Genotype, growth type, and origin of the common bean genotypes used in the research. Quevedo, Los Ríos, Ecuador
Field experiments
For 2010-2011 the experiment was established in a successive bean crop season area. The soil was mechanically prepared three days before sowing. The seeds were treated before being sown with carbendazim fungicide (200 mL per 100 kg seeds-1). Using a conventional sowing system, two seeds per site were sown, spaced 0.20 m between plants and 0.50 m between rows, resulting in an approximate density of 100000 plants ha-1. Each plot was comprised of four 7.5 m2 plant rows totaling 65 m2. Fertilization consisted of applications of N, P, K in 100 kg ha-1 doses, at 13 and 27 days after sowing (DAS). A foliar biostimulant (containing macro and microelements, phytohormones, humic acids, and vitamins) was also applied at 68 DAS (1.5 L ha-1). The weeds were controlled with glyphosate and pendimethalin with 2 L ha-1 doses each and manual weeding during crop establishment. For insect pests, lambda-cyhalothrin (0.2 L ha-1), methomyl (0.5 kg ha-1), and pyrochlore (0.5 L ha-1) were applied on three occasions. To compensate for crop water needs, several sprinkler irrigations were carried out. No fungicides were used.
In the 2012 season, the experiment was established in a previous banana crop field. All experiments were the same as the 2010-2011 experimental management, except for plant density. Two seeds per hole were sown in a 0.20 m between plants x 0.60 m between rows scheme, resulting in a planting density of approximately 90000 plants ha-1. Each plot was composed of four rows of plants and 9 m2, totaling 96 m2. All cultural management according to the previous seasons was developed.
Disease assessment
Web blight incidence (%) was measured during five (2011 and 2012) and six (2010) consecutive weeks, from the phenological stage R6 (full flowering). Central leaflets were taken from the lower, middle, and upper canopy strata from four plants located in the two rows outside the proper plot (two central rows) in each treatment (genotype), totaling 12 leaflets. Leaflets with lesions larger than 2 mm were classified as diseased. The plant material was analyzed in a stereomicroscope with a 2X optical magnification binocular lens during the first two weeks. The diseased leaflets percentage defined this variable.
To verify the presence of the causal agent, some infected leaflets were placed for a few days in a humid chamber with a photoperiod of 12 h at room temperature. Subsequently, different samples were prepared to observe morphological characteristics (mycelium) of the microorganism associated with web blight symptoms.
Experimental design and statistical analysis
A randomized complete block design (RCBD) was used in each experiment, with four blocks for each treatment (genotypes). All the values obtained in the experiments were integrated as the area under the disease progress curve (AUDPC).
For the analysis of disease progress, the disease progress rate (r) was calculated using the Logistic model equation10 (Eq. 1); y=1(1+exp (-a+rt)) (1), where y = disease proportion (0 < y <1), a = logit (y0), r = rate, and t = time; the Gompertz model equation10 (Eq. 2): y=exp (-B*exp (-kt)) (2), where B is a position parameter, k = rate, and t = time, and the exponential model equation (Eq. 3); y= y0exprt (3) where y0 is the initial value, r is the rate and t the time.
AUDPC, model curve calculation, and residuals were estimated using the epifitter package13 for Rstudio14. All figures were plotted using GGPLOT15.
After verifying the homogeneity of the variance of the data sets, the data were subjected to analysis of variance. Tukey (P ≤ 0.05) test was used to make the comparisons. Pearson correlation between mean meteorological variables and disease progression was performed (P ≤ 0.05).
RESULTS
The average temperature was 24.2, 25.1, and 23.3 ºC, and growing season precipitation was 390, 179, and 149 mm, respectively, in 2010, 2011, and 2012. The relationship between mean meteorological variables used in this study and disease progression was not found (data not shown).
Hyphal branching varied from 45 to 90° (spores were not found) was observed (Figure 2A) when mounting specimens in the microscope from samples in symptomatic leaf tissue previously placed in a humid chamber. Regarding symptoms, the lesions began as necrotic spots with a yellowish halo (Figure 2B) that increased over with time until they became brown and dark-bordered, covering the leaflet area forming a cobweb (Figure 2C).
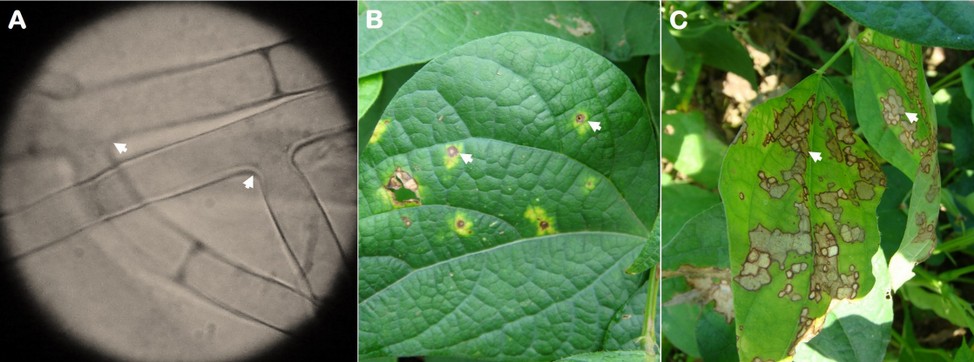
Figure 2. Rhizoctonia solani mycelium (A) and web blight symptoms (B and C) observed on common bean leaflets. The arrows indicate the angle of 45 and 90 º of the mycelium and the disease lesions.
The progress of the web blight varied between genotypes and years (Figure 3). In 2010, disease incidence was practically similar in the three evaluated genotypes (Figure 3A). Although in 2011 (Figure 3B) and 2012 (Figure 3B), the incidence was higher in the commercial INIAP 473 variety, the disease began a little earlier, only in the first year.
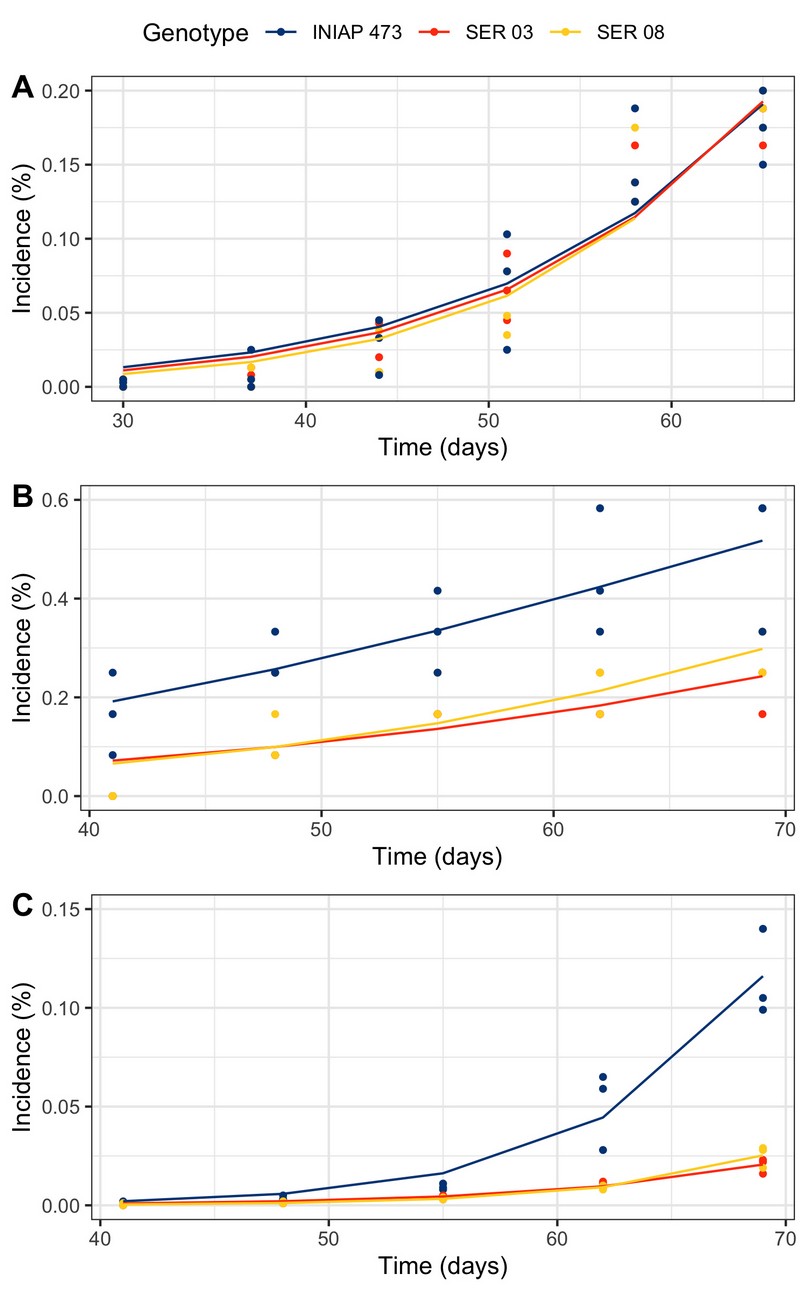
Figure 3. Web blight progress from incidence proportion in INIAP 473, SER 03, and SER 08 common bean genotypes, established in 2010 (A), 2011 (B), and 2012 (C), Quevedo, Los Ríos, Ecuador.
In general, the amount of initial disease (y0) and progress rate (r) obtained from web blight incidence varied between genotypes only in some years using the Exponential, Gompertz, and Logistic, nonlinear models (Table 2). Curve analyses were significant (P ≤ 0.05) in all genotypes and models in 2010 and 2012, and 2011 but only for the Exponential model.
When both epidemiological parameters were compared, no significant difference was observed between genotypes in any model from 2010. Using the exponential model, y0 was higher in the INIAP 473 variety (three times on average) and in the SER 03 (four times on average) in 2011 and 2012, respectively, compared to the other genotypes. Using the same model in 2011, the r was higher in the SER 03 and SER 08 genotypes (three times on average) compared to the commercial variety. Regarding the Gompertz model, in 2012, the INIAP 473 and SER 08 genotypes (twice on average) presented the highest y0 compared to the SER 03, while the r was higher only for INIAP 473 (six times in average), compared to the other two genotypes. Finally, only y0 was higher in the INIAP 473 genotype (three times on average) than SER 03 and SER 08 in 2012 for the logistic model approach.

Table 2. Initial disease (y0), and progress rate (r) using Exponential, Gompertz, and Logistic nonlinear models, from web blight incidence in INIAP 473, SER 03, and SER 08 genotypes, established in 2010, 2011, and 2012, Quevedo, Los Ríos, Ecuador. Coefficient of determination (R2), and probability value (P-value) statistical parameters
The lowest mean square of residuals (MSR) was obtained in the INIAP 473 and SER 03 genotypes with the Logistic, Gompertz, and Exponential models in 2010, 2011, and 2012, respectively (Table 3). Although this pattern (models and years) was recurrent in the SER 08, lower MSRs were also observed using the Gompertz and Exponential models in 2011 and 2012, respectively.
The residuals of the progress curves (Figure 4) varied considerably between genotypes and epidemiological models only in 2011 and 2012, having a similar pattern between the factors analyzed in 2010. Although in 2011 and 2012 the points were located closer to the central axis, this was more evident in the last year. In fact, in 2012 the residuals were lower in the SER 03 and SER 08 lines using all nonlinear models, compared to the INIAP 473 in the same year, and with the other factors analyzed in 2010 and 2011.

Table 3. Mean squares of residuals obtained using Exponential, Gompertz, and Logistic nonlinear models, from web blight incidence in INIAP 473, SER 03, and SER 08 genotypes, established in 2010, 2011, and 2012, Quevedo, Los Ríos, Ecuador. Coefficient of determination (R2), and probability value (P-value) statistical parameters
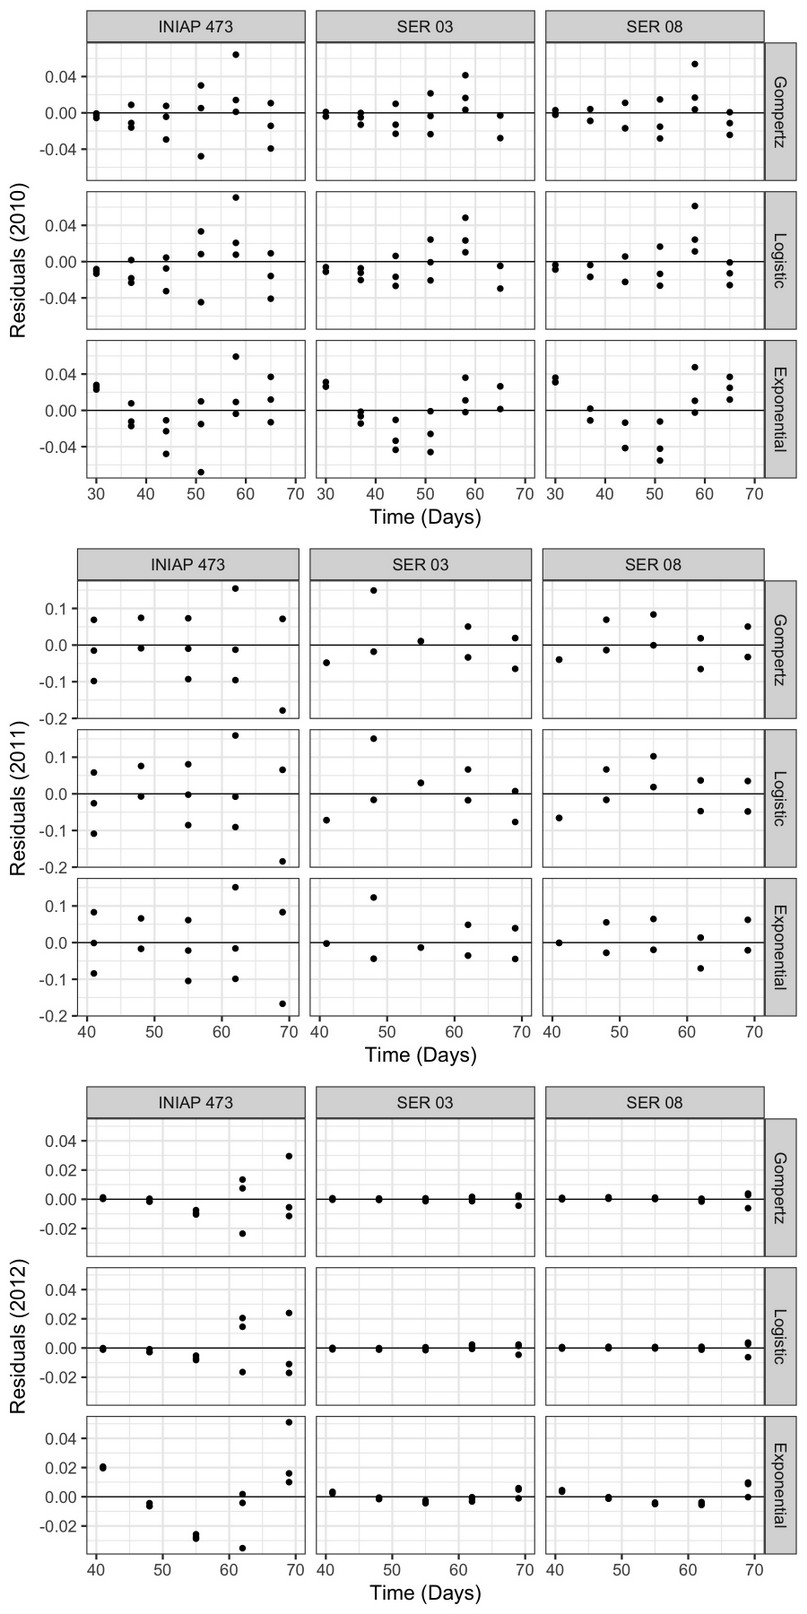
Figure 4. Progress curve residuals obtained using the Exponential, Gompertz, and Logistic nonlinear models, from web blight incidence in INIAP 473, SER 03, and SER 08 genotypes, established in 2010, 2011, and 2012, Quevedo, Los Ríos, Ecuador.
The final incidence (%) and the AUDPC of web blight (Figure 5) were similar in plants of all genotypes analyzed (17% and 2 units on average) in 2010 (Figures 5A and 5B). Instead, plants of commercial variety INIAP 307 presented a final incidence and AUDPC between two (Figures 5C and 5D) and five (Figures 5E and 5F) times higher in 2011 and 2012, respectively, when compared to those of the SER 03 and SER 08. Concerning the amount of disease in each of the three years evaluated, the highest final incidence and AUDPC were observed in 2011 (50% and 10 units in the INIAP 473 variety), followed by 2010 (17% and 2 units on average) and 2012 (12% and 0.8 units in the INIAP 473 variety).
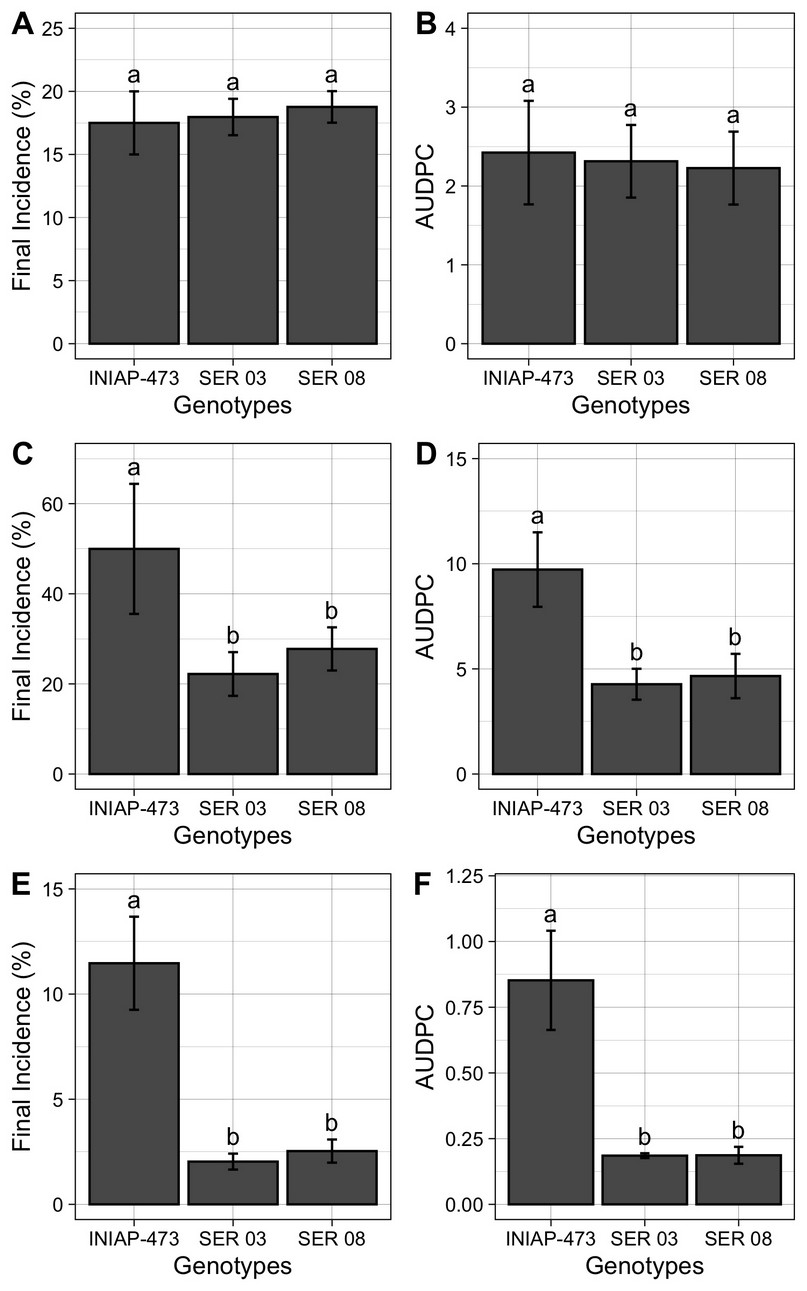
Figure 5. Final incidence (%), and area Under the Disease Progress Curve (AUDPC) of web blight in the INIAP 473, SER 03 and SER genotypes of common beans, established in 2010 (A and B), 2011 (C and D) and 2012 (E and F), Quevedo, Los Ríos, Ecuador. Letters indicate similarity or statistical difference (P ≤ 0.01) among genotypes in each year by Tukey test. Bars represent the standard deviations of mean.
DISCUSSION
Web blight is one of the main diseases that negatively affect grain yield, both in monoculture and in association with others, on the central coast of the Ecuadorian coast4,5,6.
For the first time in Ecuador, in three common bean genotypes with a differentiated response to web blight, using the incidence, the epidemic was modeled using the nonlinear Exponential, Logistic, and Gompertz models, obtaining even epidemiological parameters such as y0 and r, for three consecutive years.
The mycelium characteristic (branching from 45 to 90°) and the observed symptoms in advanced stages (web shape) of the disease suggest that the causal agent is R. solani. Furthermore, these results are similar to those observed4, who found similar morphological characteristics in the vegetative tissues of this phytopathogenic fungus, but in common bean seedlings with damping-off symptoms. Even in Ecuador or other countries, R. solani has been found in both underground and aerial organs3.
The progress curves obtained from the proportion of the incidence of web blight in common bean plants were different in each genotype and year. Although in 2010 the incidence was similar in the three genotypes evaluated, in the following years, it was higher only in the commercial variety INIAP 473. In part, this result was similar to that of the epidemiological parameters, especially in 2010, where there were no differences between genotypes. However, both the amount y0 and r varied between genotypes in a differentiated way in 2011 and 2012, generally observing the sanitary inferiority of the INIAP variety 473.
Web blight may be influenced by environmental conditions, being more intense in lowland areas with hot and humid conditions16, especially between 25 and 100% humidity17. These conditions are similar to those of the study areas. Although the pluvial precipitation was higher in 2010, the disease incidence was higher in 2011. This suggests that temperature was the only environmental factor that affected the amount of disease in bean plants. The optimum temperature for mycelial growth in the soil is between 20 and 25 °C, regardless of the anastomosis group18. It seems that the pathogen increased its aggressiveness in temperatures above 25 ºC, as in 2011. Some strains are highly virulent at higher temperatures19.
It must be considered that y0 is of particular interest as an epidemic component for root diseases caused by soil-borne pathogens10, such as R. solani. In order, r may be negatively affected by the nature of the host’s resistance, consequently, the model to be used must be well fitted20. In the nonlinear models used, the Exponential can be used for the initial phases of an epidemic, when disease intensity does not exceed 5%12.. Therefore, to compare the epidemiological parameters between genotypes, the Gompertz, and Logistic models can be used. A higher y0 was obtained in INIAP 473 plants using both models, while a higher r was observed in plants of the same genotype in 2012. If it is considered that in 2010, the experiment was established in a different place than the others, and having previously been occupied by a banana crop, possibly the only source of inoculum was found in the seed. Thus, this y0 also caused a significant increase in r in INIAP 473 plants.
Although high determination coefficients (R2) were obtained in different genotypes and years from each of the epidemiological methods used, this cannot serve as a standard21. On the contrary, smaller MSR and residuals obtained from epidemiological models may be used to choose the model that best explains the disease5,22. Under the conditions under which the experiments were carried out, both decision variables differed on the year and genotype studied. Generally, in other crops, the Logistic and Gompertz models can satisfactorily explain the progress of some diseases, while Gompertz can better model diseases such as rusts7.
Even on some occasions, the use of epidemiological models can help determine the etiology of the disease12. The response of the genotypes and temporal conditions of each locality possibly influenced the epidemic modeling. Anyhow, taking the lowest MSR as a parameter to choose the best model, we can mention the Logistic model that better describes the epidemic caused by web blight in common beans.
The final incidence and AUDPC of web blight were higher in INIAP 473 in 2011 and 2012. On the one hand, the differentiated response to web blight or another disease caused by R solani has already been reported in common beans3,5 and other crops23. Concerning the superiority of the SER 03 and SER 08 genotypes, as they present a lower incidence and AUDPC, this is similar to that others’ work reported3,5, in the same experimental conditions, finding a lower disease intensity in foliar and root tissues of both common bean lineages. Although the mechanisms used by these advanced common bean lines to defend against R. solani are unidentified, they could be associated with physical24 and molecular factors25. To date, no common bean genotypes with complete resistance against R. solani have been found in Ecuador, as happens in other beans, where late colonization materials may be an option for this disease management24.
In 2011, a higher final incidence and AUDPC were observed in plants of the three genotypes studied, compared to 2010 and 2012. Two suggestions can be raised to explain this comportment: the source soil inoculum and the R. solani seed dissemination. The source of pathogen inoculum found in the soil due to 2010 beans establishment, and even in years before this, seems to have caused a considerable increase in 2011 plants disease26,27. However, the low amount of the disease observed in 2012 was because the only source of inoculum was found in the seed, and the pathogen could have spread through the seed27,28. The experiment established in this last year was in a different place than in the other years, having previously been occupied by a banana crop. This implies that carbendazim seed treatment did not show efficacy, despite the fact that this fungicide is used to control R. solani29.
CONCLUSIONS
Under the conditions of these experiments, all the web blight evaluated parameters the progress curves, epidemiological parameters, and other evaluated plant-health variables were lower in the INIAP 473 variety than the other genotypes in 2011 and 2012. Soil and seeds inoculum and temperature play an important role in expected bean crop web blight increase. The Logistic model better described the progress of the web blight in the conditions of the central coast of Ecuador.
Author Contributions: Analyzed and interpreted the data, and wrote the manuscript Chávez-García WR, Mera-Vera FN, and Portalanza D. Designed, performed, and supervised the experiments, interpreted the data, and wrote the manuscript Garcés-Fiallos, FR. All authors of this paper have read and approved the final version of submitted manuscript.
Funding: This research was funded by the project “Rendimiento de líneas arbustivas y volubles de fréjol procedentes del CIAT, Colombia”, at State Technical University of Quevedo (UTEQ).
Conflicts of Interest: The authors declare no conflict of interest.
REFERENCES
1. Sistema de Información Publica Agropecuaria (SIPA). Available online: http://sipa.agricultura.gob.ec/index.php/cifras-agroproductivas (accessed on 15 september 2021).
2. SINAGAP. Fréjol Tierno y Seco, Sistema Nacional del Ministerio de Agricultura: Quito, Ecuador, 2018; pp. 12-143.
3. Garcés-Fiallos, F.R.; Gamarra, H,V,;, Garcés-Estrella, R.E. Doenças e produtividade de genótipos promissores de feijão comum em Quevedo, Equador. Rev. Bras. Cienc. Agrar. 2015, 10, 128-133. https://doi.org/10.5039/agraria.v10i1a5254
4. Garcés-Fiallos, F.R. Cuantificación de enfermedades en líneas promisorias y variedades de fréjol en Quevedo, Ecuador. Rev. Bio. Agro. 2013, 11, 196-207.
5. Garcés-Fiallos, F.R.; Vera, F.D. Progreso de enfermedades foliares en el cultivo de trigo en Passo Fundo, RS, Brasil. Sci. Agropecu. 2011, 2, 255-259. https://doi.org/10.17268/sci.agropecu.2011.04.07
6. Godoy-Montiel, L.; González-Osorio, B.; Defaz-Defaz, E.; Díaz-Coronel, T.G.; Vásconez-Montúfar, G.H. Evaluación de dos variedades de fréjol durante tres épocas de siembra bajo sistema de cultivo asociado con maíz. Cienc. Tecnol. 2011, 4, 5-11. https://doi.org/10.18779/cyt.v4i1.98
7. Garcés-Fiallos, F.R. Modelo de ponto crítico para estimar danos causados pela mela na cultura do feijoeiro. Cienc. Tecnol. 2011, 4, 1-4. https://doi.org/10.18779/cyt.v4i1.99
8. Savary, A.; Nelson, A.D.; Djurle, A.; Esker, P.D.; Sparks, A.; Amorim, L.; Bergamin Filho, A.; Caffi, T.; Castilla, N.P.; Garrett, K.A.; McRoberts, N.; Rossi, V.; Yuen, J.E.; Willocquet, L. Concepts, approaches, and avenues for modeling crop losses. Eur. J. Agron. 2018, 100, 132 -141. https://doi.org/10.1016/j.eja.2018.04.003
9. Van der Plank, J. E. Analysis of epidemics. In Plant Pathology. An Advanced Treatise, The Diseased Population. Epidemics and Control, 1st ed.; Horsfall, J.G.; Dimond, A.E., Academic Press: New York, United States of America, 1960; Volume 3, pp. 229-289.
10. Campbell, C.L.; Madden, L.V. Introduction to Plant Disease Epidemiology, 1st ed.; John Wiley & Sons: United States of America, 1990. pp. 1-532.
11. Van Maanen, V.; Xu, X.M. Modelling plant disease epidemics. Eur. J. Plant Pathol. 2003, 109, 670-682. https://doi.org/10.1023/A:1026018005613
12. Bergamin Filho, A. Análise temporal de epidemias. In Manual de Fituopatología. Principios e Conceitos, 5th ed.; Amorim, L.; Rezende, J.A.M.; Bergamin Filho, A.; Agronômica Ceres: Ouro Preto, Brasil, 2018; Volume I, pp. 519-530.
13. Alves, K.S.; Del Ponte, E.M. Analysis and simulation of plant disease progress curves in R: introducing the epifitter package. Phytopathol. Res. 2021, 3, 22. https://doi.org/10.1186/s42483-021-00098-7
14. RStudio Team. RStudio. Available online: http://www.rstudio.com/ (accessed on 14 August 2021).
15. Wickham, H. Package “ggplot2” Title Create Elegant Data, 1st ed.; Springer: New York, United States of American, 2009; p. 213. https://doi.org/10.1007/978-0-387-98141-3
16. Cuenca-Tinoco, A.C.; Castro-Delgado, N.I.; Cargua-Chávez, J.E.; Cedeño-García, G.A.; Cedeño-Zambrano, J.L. Efectivity of amendments on growth and yield of common beans in an acidic andisol soil. Temas Agrarios, 2020, 25, 54-65. https://doi.org/10.21897/rta.v25i1.2236
17. Bolton J, Brown. Photosynthesis of grass species differing in carbon dioxide fixation pathways: V. Response of Panicum maximum, Panicum milioides, and Tall fescue (Festuca arundinacea) to nitrogen nutrition. Plant Physiol. 1980, 66, 97-100. https://doi.org/10.1104/pp.66.1.97
18. Ritchie, F.; Bain, R.A.; McQuilken, M.P. Effects of nutrient status, temperature and pH on mycelial growth, sclerotial production and germination of Rhizoctonia solani from potato. J. Plant Pathol. 2009, 91, 589-596. http://dx.doi.org/10.4454/jpp.v91i3.550
19. Schultz, F.A,; Bateman, D.F. Temperature response of seeds during the early phases of germination and its relation to injury by Rhizoctonia solani. Phytopathology 1969, 59, 352-355.
20. Shtienberg, D. Modelling: the basis for rational disease management. Crop Prot. 2000, 19, 747-752. https://doi.org/10.1016/S0261-2194(00)00099-5
21. Jeger MJ. Asymptotic behaviour and threshold criteria in model plant disease epidemics. Plant Pathol., 1986. 35. 355–361. https://doi.org/10.1111/j.1365-3059.1986.tb02026.x
22. Bergamin Filho, A.; Amorim, L.; Laranjeira, F.F.; Berger, R.D.; Hau, B. Análise temporal do amarelecimento fatal do dendezeiro como ferramenta para elucidar sua etiologia. Fitopatol. Bras. 1998, 23, 391–396.
23. Prabhu, A.S.; Filippi, M.C.; da Silva, G.B.; de Santos, G.R. Resistência de cultivares de arroz a Rhizoctonia solani e Rhizoctonia oryzae. Pesqui. Agropecu. Bras. 1983, 37, 1323-1332. https://doi.org/10.1590/S0100-204X2002000500003
24. Bashyal, B.M.; Kharayat, B.S; Kumar, J.S. ; Dubey, S.C.; Aggarwal, R. Histopathological studies of Rhizoctonia solani infection process in different cultivars of mungbean: Vigna radiata (L.) Wilczek. Natl. Acad. Sci. Lett. 2018, 41, 269-273. https://doi.org/10.1007/s40009-018-0669-3
25. Oladzad, A.; Zitnick-Anderson, K.; Jain, S.; Simons, K.; Osorno, J.M.; McClean, P.E.; Pasche, J.S. Genotypes and genomic regions associated with Rhizoctonia solani resistance in common bean. Front. Plant Sci. 2019, 10, 956. https://doi.org/10.3389/fpls.2019.00956
26. Andrade, D.E.G.T.; Silva, C.F.B.; Silva, L.G.C.; Michereff, S.J.; Sales Júnior, R.; Assis, T.C. Influência da densidade de inóculo e de isolados de Rhizoctonia solani na severidade da rizoctoniose do meloeiro. Caatinga 2005, 18, 164-168.
27. Garcés-Fiallos, F.R.; TayHing-Cajas, C.C.; Sánchez-Mora, F.D.; Gamarra-Yánez, H.V. Modelos integral e de ponto crítico para estimar danos no rendimento e seus componentes pela mela na cultura do feijoeiro. Cienc. Tecnol. 2013, 6, 17-22. https://doi.org/10.18779/cyt.v6i1.127
28. Oliveira, J.A.; de Andrade, M.J.B.; Fraga, A.C. Eficiência de fungicidas no tratamento de sementes de feijão (Phaseolus vulgaris L.) para o controle da podridão radicular causada por Rhizoctonia solani Kuhn. Rev. Bras. Sementes 1997, 19, 91-95.
29. Cheng, X.; Man, X.; Wang, Z.; Liang, L.; Zhang, F.; Wang, Z.; Liu, P.; Lei, B.; Hao, J.; Liu, X. Fungicide SYP-14288 Inducing multidrug resistance in Rhizoctonia solani. Plant Dis. 2020, 104, 2563-2570. https://doi.org/10.1094/PDIS-01-20-0048
Received: 26 November 2021 / Accepted: 13 January 2022 / Published: date. 15 February 2022
Citation: Chávez-García, W.R.; Mera-Vera, F.N.; Portalanza, D.; Garcés-Fiallos FR, Temporal progress of web blight in three common bean genotypes on the central coast of Ecuador. Revis Bionatura 2022;7(1). 35. http://dx.doi.org/10.21931/RB/2022.07.01.35