2022.07.03.31
Files > Volume 7 > Vol 7 No 3 2022
Coffee's Phenolic Compounds. A general overview of the coffee fruit's phenolic composition.

Ostilio R. Portillo*1 and Ana C. Arévalo2
1 Faculty of Engineering, National Autonomous University of Honduras, Tegucigalpa (UNAH), Honduras.
2 Faculty of Chemistry & Pharmacy, National Autonomous University of Honduras, Tegucigalpa (UNAH), Honduras.
* Correspondence: [email protected]; Tel.: 504-9376-1660
Available from: http://dx.doi.org/10.21931/RB/2022.07.03.31
ABSTRACT
Phenolic compounds are secondary metabolites ubiquitously distributed in the plant kingdom which come in a wide array of molecular configurations which confer them a comprehensive set of chemical attributes such as, but not limited to: nutraceutical properties, industrial applications (e.g., dyes, rawhide processing, beer production, antioxidants), and plant self-defense mechanisms against natural enemies also known as the Systemic Acquired Resistance (SAR).However, despite the fact, that there is a large number of phenolic-containing food products (e.g., chocolate, green tea, wines, beer, wood barrel-aged spirits, cherries, grapes, apples, peaches, plums, pears, etc.), coffee remains, in the western hemisphere, as the main source of dietary phenolic compounds reflected by the fact that, in the international market, coffee occupies the second trading position after oil and its derivatives. The following discussion is the product of an extensive review of scientific literature that aims to describe essential topics related to coffee phenolic compounds, especially chlorogenic acids, their purpose in nature, biosynthesis, determination, metabolism, chemical properties, and their effect on cup quality.
Keywords: phenolic acids, caffeoylquinic acid, antioxidant capacity, metabolism, biosynthesis.
The majority of polyphenolic compounds (e.g., flavonoids and phenolic acids) present in coffee are characterized by presenting in their molecular structure a basic nucleus of 15 carbons distributed in two aromatic rings (A & B) linked by three carbons (ring C) 1 and among these the most abundant are chlorogenic acids (CAs) which are esters formed by quinic acid by esterification with trans-cinnamic acids such as caffeic acid, p-coumaric acid, and ferulic acid.
They are a group of secondary metabolites derived from phenylalanine which are involved in the defense, structure, and survival of plants, so they play an important role in adapting them to stress conditions (eg, diseases and pests).2 According to Joet et al. 3, "CAs are a source of cinnamic acid derivatives and are therefore considered intermediate precursors of lignin".
The CAs constitute the predominant water-soluble, non-volatile polyphenolic fraction present in the coffee bean endosperm 4,5, although they can also be found, in smaller quantities, in the leaves and pulp.
Finally, it's in planta function is associated with resistance to certain diseases,3,6,7 which seems to be evidenced by high CAs levels in varieties resistant to coffee cherry disease (Colletotrichum kahawae) versus the low levels recorded in susceptible ones.7 They also protect plants because they confer the ability to absorb ultraviolet rays.8
Biosynthesis
CAs are synthesized through the esterification of transcinnamic acids (ie, caffeic acid, ferulic acid, and p-coumaric acid) with quinic acid (Figure 1).1,4,8-14 CAs can be divided according to the number of cinnamic substituents and their coupling position to the cyclohexane ring of the quinic acid.
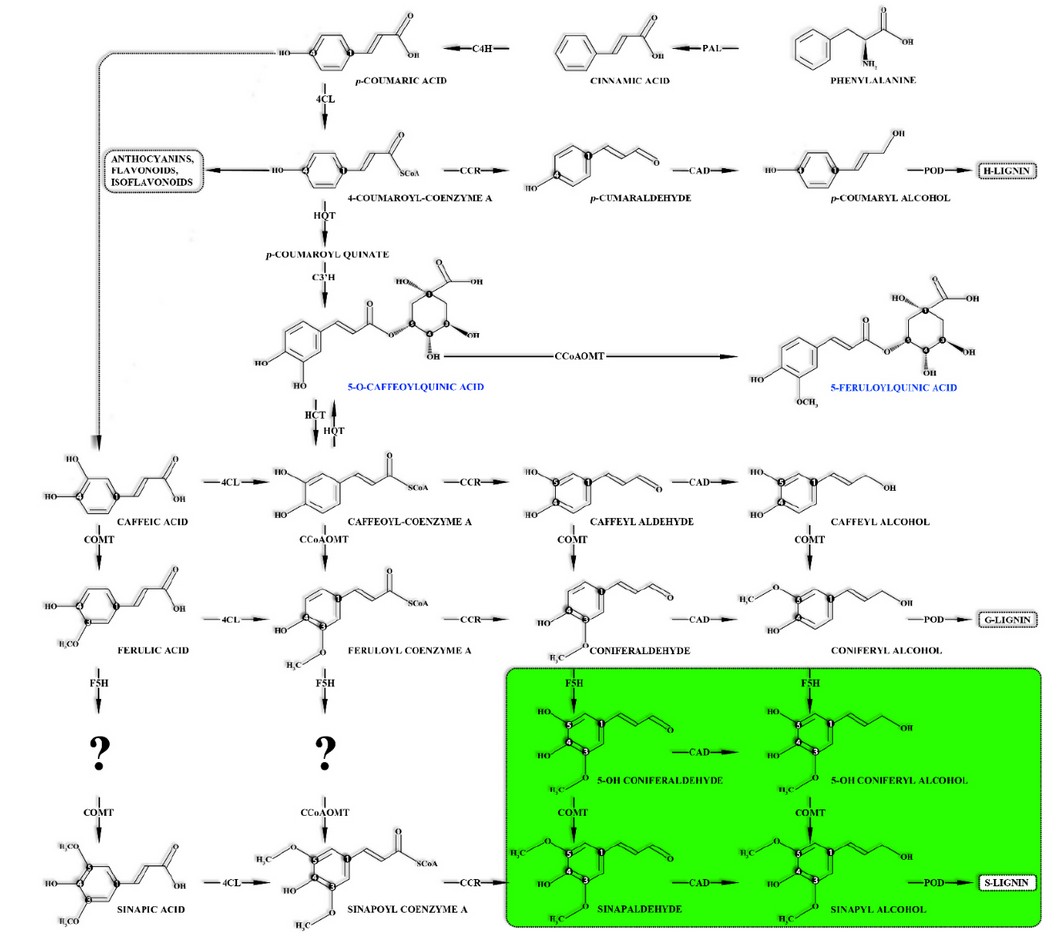
The metabolic segment that leads to the siripolysaccharidesngil lignin synthesis (green section) is exclusive of angiosperms.
Cinnamoyl-CoA reductase (CCR) | Cinnamon alcohol dehydrogenase (CAD) | 4-coumate: CoA ligase (4CL).
Caffeoyl-CoA 3-O-methyltransferase (CCoAOMT) | Caffeic acid O-methyltransferase (COMT).
Feruloyl-CoA quinato feruloyl transferase (FQT) | 5-hydroxylase ferulate (F5H).
Hydroxycinnamoyl-CoA quinate hydroxycinnamoyl transferase (HQT) | p-Coumaroyl CoA 3-hydroxylase (C3'H).
Hydroxycinnamoyl-CoA: shikimate/quinate hydroxycinnamoyl transferase (HCT) | Secretory peroxidase (POD).
Phenylalanine ammonia liasa (PAL) | Trans-cinnamate 4-hydroxylase (C4H) | p-Coumaroyl CoA 3-hydroxylase (C3’H).
Adapted from Joët et al. 6, Cheng et al. 2, Joët et al. 19, & Weng et al. 15.
Figure 1. The metabolic pathway for the synthesis of CAs and monolignols.
In coffee, CAs biosynthesis occurs in the perisperm 16 and the leaves and then are transported and intracellularly accumulated in the seeds forming complexes with caffeine 3 and reach their maximum concentration when the fruits are green.2,17
The CAs concentration in the coffee bean endosperm is a maternal quantitative trait with additive effects in in-tra-specific crosses 18 which follows a sigmoid trajectory and it varies during seed development, recording its greatest accumulation four weeks before grain maturation 19; However, CAs are strongly synthesized in the early stages of endosperm development; constituting between 15 to 20% of the grain on a dried matter basis.3
The evidence suggests this phenomenon is attributed to the genes responsible for CAs biosynthesis which are highly transcribed during the early stages of endosperm formation and their activity declines as the grain reaches maturity.20
On the other hand, during germination, a CAs fraction stored in the coffee seed endosperm is mobilized and used as precursors for monolignols biosynthesis (ie, guaiacyl, syringyl & p-hydroxyphenyl) which are the building blocks used in lignin production required for embryo development.3,21
The coffee CAs' subgroups generally have three isomeric forms which differ depending on the number and position of the acyl groups in which the quinic acid is esterified.12 The CAs nomenclature is based on the numbering system developed by the International Union of Applied Pure Chemistry (IUPAC) 22 and so far the identified CAs's subgroups in coffee are, but not limited to:
· Six diesters of caffeoyl-feruloyl-quinic acids (CFQA) and feruloyl-caffeoyl-quinic acids (FCQA) that are only present in Robusta coffee (Figure 2).23,24
· Monocaffeoyl-quinic acids (isomers: 3-, 4- & 5-CQA) responsible for 76 to 80% of CAs (Figure 3).8,10,13,25
· Dicaffeoyl-quinic acids (isomers: 3,4-, 3,5- & 4,5-diCQA) responsible for 15 to 20% of the total CAs (Figure 3).2-4,10,17,26
· Dimethoxy-cinnamoyl-caffeoyl-quinic acids.27
· Monoferuloyl-quinic acids (isomers: 3-, 4- & 5-FQA) responsible for 5 to 13% of the total (Figure 3).2,3,10,17,26
· Diferuloyl-quinic acids and dimethoxy-cinnamoyl-feruloyl-quinic acids.27
· p-Coumaroyl-quinic acids (isomers: 3-, 4- & 5-CQA) (Figure 3).1,26,28
· Di-p-coumaroyl-quinic acids & p-Coumaroyl-caffeoyl-quinic acids.27
· p-Coumaroyl-feruloyl-quinic acids.27
· p-Coumaroyl-dimethoxy-cinnamoyl-quinic acids.27
· Dimethoxy-cinnamoyl-quinic acids.27
Recently, new CAs in coffee beans have been reported in trace amounts,11 but for a complete list of the 82 CAs of raw coffee beans registered to date consult Wei et al. 11 & Narita et al. 10
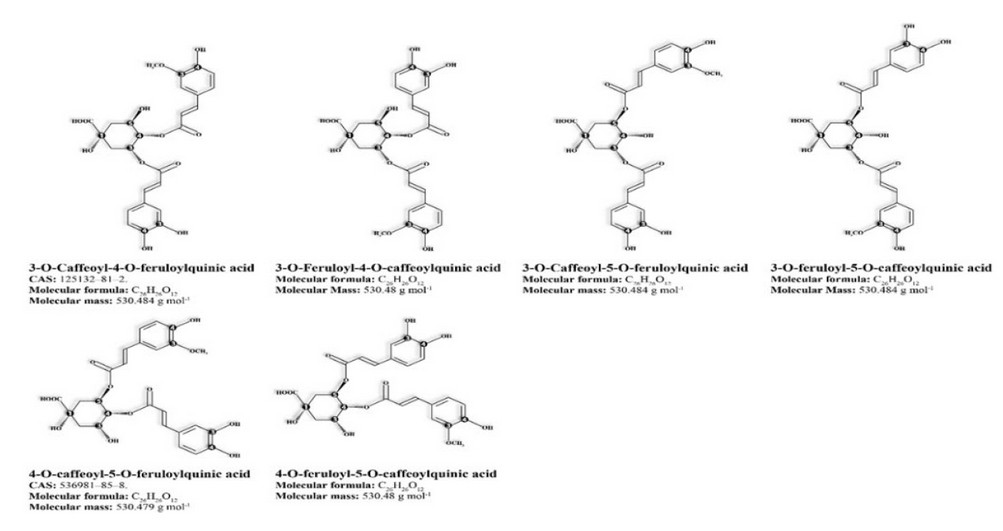
Figure 2. Robusta coffees' mixed diesters of caffeoylferuloyl-quinic acids.
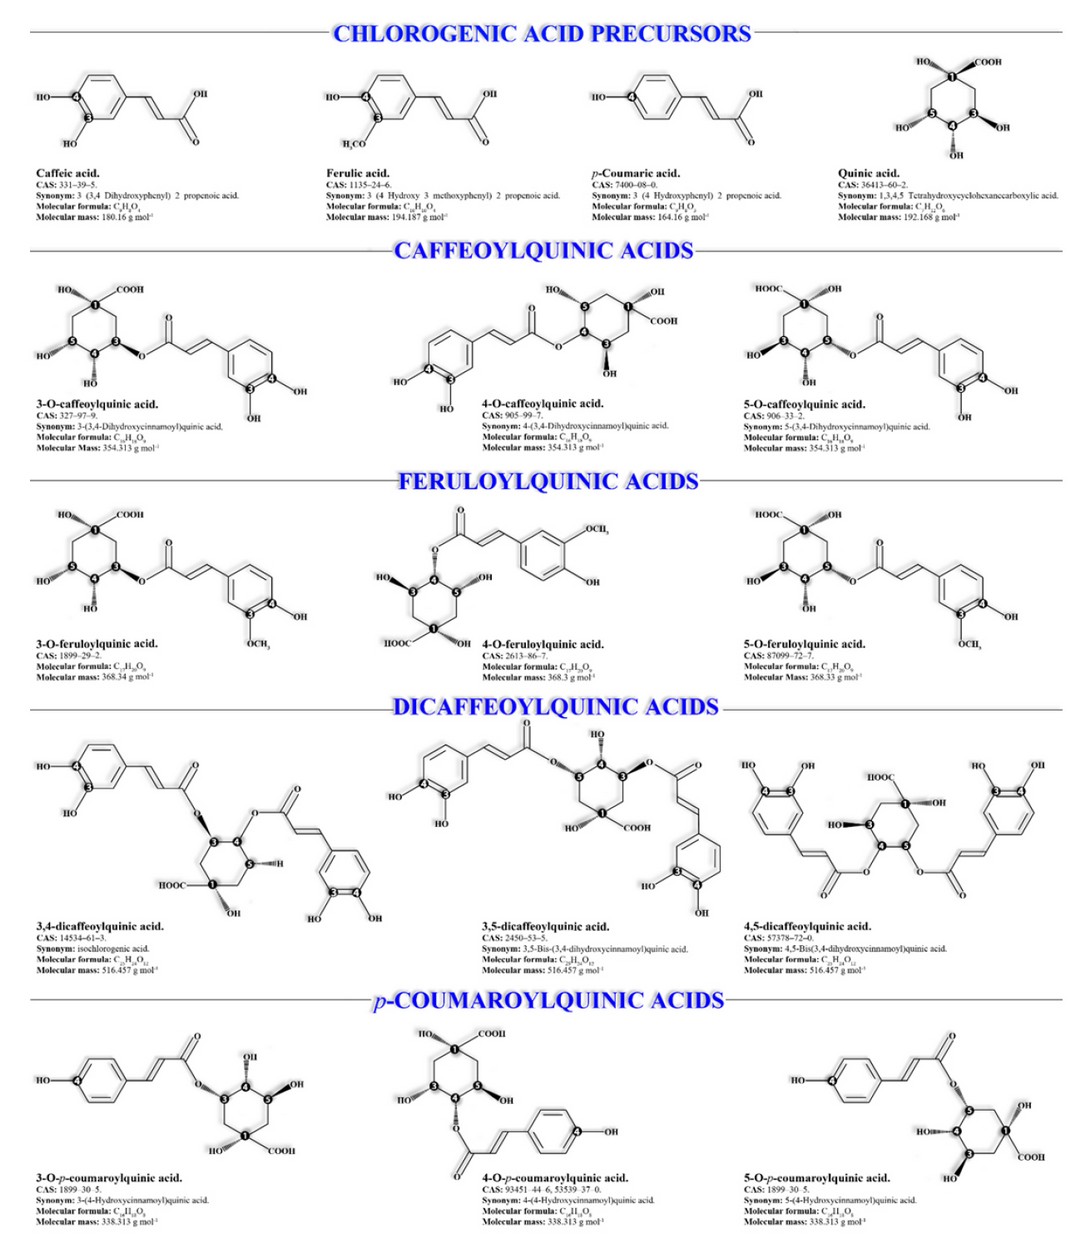
Figure 3. Chlorogenic acids and their precursors.
CAs content in coffee
ACs are the precursors of phenolic compounds in roasted coffee beans 6 and are found in relatively large quantities in both coffee beans and coffee leaves.29 On average, C. canephora and C. arabica grains vary between 10 to 11.3% 6,14,27,29 and 6 to 7% on a dried matter, respectively 3,6,14,21; however, other authors report ranges between 7 to 14.4% and 4 to 8.4% respectively.2,4,23
The difference in CAs concentration between Robusta and Arabica coffee varieties is attributed to monocaffeoylquinic, mono-feruloylquinic and dicaffeoylquinic acids levels are approximately 1.2, 3 & 2 times higher in C. canephora than what is observed in C. arabica.10
According to Caprioli et al. (30), there is a clear trend in CAs levels found in roasted coffee beans which have been also reported by several authors that shows that mono-caffeoylquinic acids are the most predominant ones followed by mono-feruloylquinic acids and dicaffeoylquinic acids. Such trend is described by the following equation:
5-CQA > 4-CQA > 3-CQA > 5-FQA > 4-FQA > 3-FQA > 3,4-diCQA > 4,5-diCQA > 3,5-diCQA > 4-FQA> 3-FQA > 3,4-diCQA > 4,5-diCQA > 3,5-diCQA.30,31
The variation in CAs concentration is influenced by the species/variety, the geographical origin,10,24,32,33 the degree of grain ripening, cultural practices,10,33 the processing method,10 environmental conditions,33 mixtures made before or after roasting,34 and the analytical method used to quantify them.
For example, according to Narita et al. (10) other species such as C. vatovavyensis, C. pseudozanguebariae, C. vianneyi, C. perrieri & C. rhamnifolia contain less than 1% of CAs (on a dried basis). Also, Marin et al. (35) found a CAs concentration gradient during different stages of coffee bean development in C. arabica in which the levels decrease depending on grain maturity (ie, immature green > mature > pinon > over-mature).
Soluble or instant coffees are a good example of CAs content variation induced by grain processing which tends to display a variable concentration largely due to Arabica and Robusta coffee blends made before roasting and to the degree of roast applied during processing.33,34 Table 1 shows the differences in CAs concentration between different types of coffee caused by the processing to which the grain is subjected.
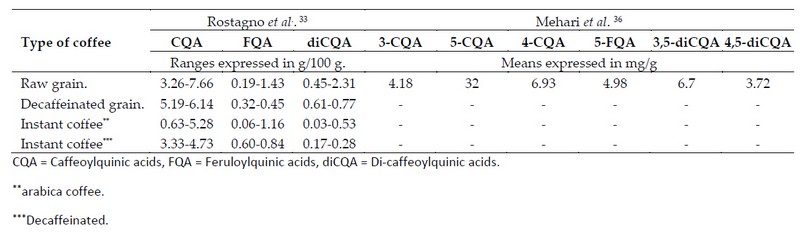
Table 1. Variation in coffee phenolic composition based on dried matter basis.
One of the differences that stands out is the drastic reduction in CAs concentration in instant coffees as a result of the heat treatments to which both the grain and the infusion are subjected during processing (ie, roasting and extraction of soluble compounds).37 Conversely, the increase in CAs concentration in instant and decaffeinated coffees is also noticeable. This can be elucidated due to the decaffeination process per se since caffeine extraction indirectly increases the relative concentration of the other analytes.37
On the other hand, abiotic factors such as water stress, high luminosity, low temperatures, boron deficiencies, and nitrogen fertilizer applications can cause an increase in CAs levels in coffee beans.4,38
Finally, the composition analysis conducted by Vaast et al. 39 revealed that CAs levels were higher in grains harvested from plants exposed to the sun than those found in grains harvested from plants grown under shade.
Determination of CAs in coffee beans
There is a wide range of analytical techniques used in the identification and quantification of phenolic compounds ranging from non-specific techniques such as the Folin-Denis test to more sensitive techniques such as High-Resolution Liquid Chromatography (HPLC) coupled to different detectors, as well as a series of methodologies that include the combination of spectroscopic techniques, mass spectrometry (MS) among others.40 However, the most widely used methods in determining CAs are HPLC, capillary electrophoresis, and micellar electrokinetic chromatography.41
CAs' extraction is carried out using polar organic solvents such as isopropanol, water, and hydro-alcoholic mixtures with MeOH and isopropanol in different proportions 38,40 through techniques of infusion extraction,42 digestion,43 and ultrasound.28
Compounds' identification and quantification can be carried out directly in the recovered extract or in the purified fractions. The most commonly used technique is HPLC 40 usually coupled to a Diode Array Detector (DAD) using gra-dients of MeOH, acetonitrile, water or mixtures of these as solvent A and an acid such as phosphoric acid, acetic acid or acid citric as solvent B.28,38,42,44
The identification is performed by comparing the retention times peaks (Rt) reported by the sample with that of the standards (controls), with subsequent structural confirmation by HPLC coupled to mass spectrometry (HPLC-MS).38,42 For the compounds quantification Farah et al. 38 reported as an analysis parameter the peak area corresponding to 5-CQA.
Samanidou 40 reported a validated analytical method for the simultaneous analysis of caffeine and polyphenols in different coffee samples (eg, Turkish coffee, instant coffee) using DLC-coupled HPLC and a MeOH-acetronityl gradient (95: 5 v/v) as solvent A and acetic acid 0.01% as solvent B.
Monitoring and quantification were performed based on each analyte's maximum wavelength (max), reporting that CAs and caffeine have a max of 330 and 270 nm, respectively; Peak identification was performed based on Rt. The reported quantification limit for this method was 0.8 to 2.0 mg l-1 for all compounds. The quantification limit is the concentration of a given analyte that produces a signal strong enough to be detected with a specific confidence level.
A typical chromatogram obtained with this method using an instant coffee sample is shown in figure 4.
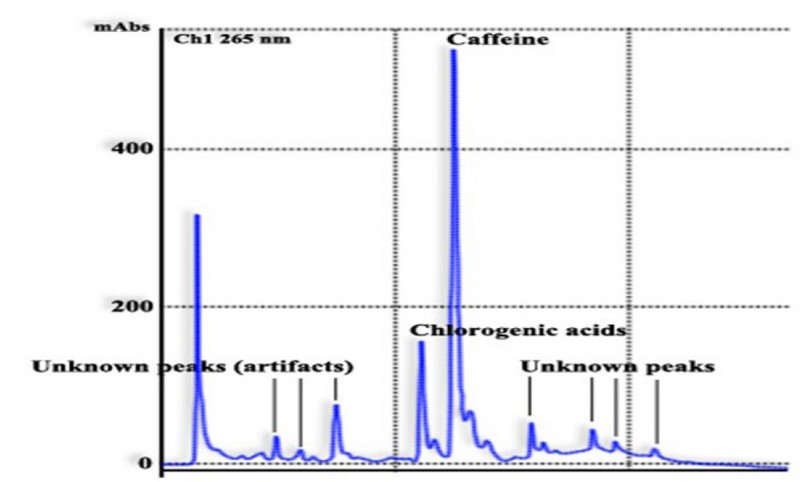
Figure 4. Typical chromatogram of CAs and caffeine simultaneous analysis from an instant coffee sample.Adapted from Samanidou 40.
Before the analysis, HPLC requires the application of specific procedures for sample preparation (ie, Size-exclusion chromatography, Solid-phase extraction or a combination of both) in addition to lengthy analysis times, the need for highly specialized technicians coupled with the fact that not many laboratories have the required equipment; Therefore, it is understandable why CAs determination in food matrices is an expensive analytical procedure.
As a result, researchers have sought more viable and economical alternatives for CAs quantification without caffeine interference, and in this order of ideas Belay et al. 41 propose a simple, fast and sensitive quantification method using an uv-visible spectrophotometer, an apparatus commonly found in most laboratories. CAs and caffeine absorb radiation in the region between 200 to 500 nm thus potentially leading to misidentification of both molecules due to their spectra over position, so Belay et al. 41 propose the use of dichloromethane to extract the caffeine first and subsequently quantify the CAs in the resulting residue.
Figure 5 shows CAs references spectrum vs the spectrum of CAs retrieved from green coffee beans extract. Sample purification (ie, caffeine extraction) was performed with dichloromethane; Therefore, an over position of the spectra can be observed, indicating the method's efficiency.
Finally, researchers compared the proposed methodology results vs those obtained through conventional HPLC quantification. The comparison showed that the results of both methodologies were similar for the analyzed samples.
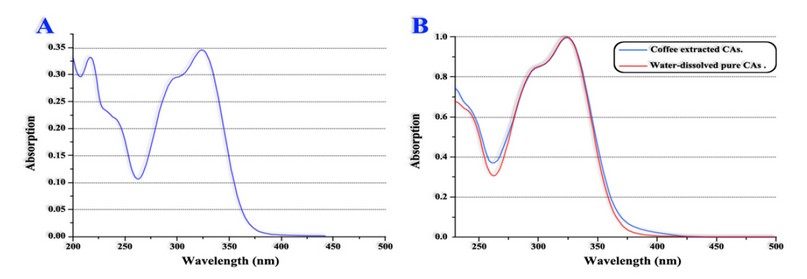
A. CAs references spectrum. B. Spectrums over position of CAs references and CAs retrieved after samples purification.
Adapted from Belay et al. 41
Figure 5. CAs' uv-visible absorption spectrum.
CAs influence on cup quality
CAs influence on coffee cup quality is controversial. CAs are essential for defining the drink quality because they affect the infusion color (pigment formation), aroma and flavor (pH and bitterness).3,4,45 However, according to Flament et al. 46 despite being in relatively large quantities, CAs do not significantly affect the coffee beverage's acidity (pH).
Likewise, there is evidence that 3,4-dicaffeoylquinic acid in high concentrations improve the quality of the beverage 19,47; In contrast, there are also reports that the addition of dicaffeoylquinic acids confers an unpleasant (bitter) taste to the infusion 2,4,16 whereas high concentrations of 5-O-caffeoylquinic acid have been associated with poor cup quality alt-hough it has been described as a non-bitter compound.48
Regardless of the conflicting reports, there is an inverse relationship between CAs levels and the quality of the coffee cup; in other words, the higher the CAs concentration, the lower the quality of the infusion.4,10,33,36
Considering that caffeoylquinic acids constitute between 76 to 82% of the total CAs present in the coffee grain endosperm 14,28 of which 5-caffeoylquinic acid (aka chlorogenic acid isolated from coffee beans for the first time by Gotter in 1908) is the most abundant being responsible for 56 to 62% of the total 4,10,12 which is tantamount to 4 to 5% of the dried weight of the grain 49 and 3-caffeoylquinic acid (aka neo-chlorogenic acid) and 4-caffeoylquinic acid (aka cryo-chlorogenic acid) each add ~ 10% to the total,4,10 then it can be concluded that in general caffeoylquinic acids, as a whole, are responsible for affecting the quality of the infusion.
Due to its higher CAs content; in addition to a more bitter taste, greater astringency, and aroma such as 'wet wood or wet cardboard' 50-52 the cup quality of C. canephora (aka Robusta) is considered inferior when compared to C. arabica 46,53,54 and the reason why commercially available coffee is produced exclusively based on C. arabica or a mixture of both.28,32,53,55,56 For this reason, the grain of Robusta varieties is commercialized for approximately half the value of C. arabica.57-59
Finally, although the concentration of phenolic compounds in the coffee cup depends on several factors such as the species/variety, the chosen method for drink preparation (Figure 6) among others (eg, roasting level, mixes before or after roasting, water temperature, etc) 34; It is estimated that the cup of Robusta coffees contains ~ 70 to 350 mg of CAs,1,60 while the cup of Arabica coffees contains ~ 70 to 200 mg of CAs.60
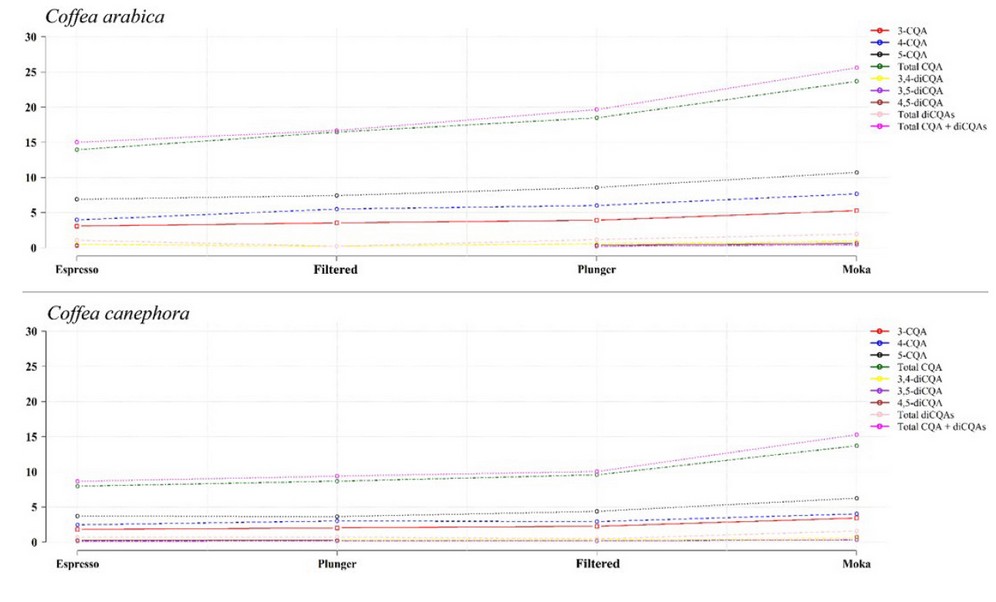
Adapted from Bravo et al. 61. Circles represent means expressed as mg/g (n = 3).
3-caffeoylquinic acid (3-CQA) | 4-caffeoylquinic acid (4-CQA) | 5-caffeoylquinic acid (5-CQA).
3,4-dicoumaroylquinic acid (3,4-diCQA) | 3,5-dicoumaroylquinic acid (3,5-diCQA).
4,5-dicoumaroylquinic acid (4,5-diCQA) | Total caffeoylquinic acids (Total CQAs).
Total dicaffeoylquinic acids (Total diCQAs).
Total caffeoylquinic acids + dicaffeoylquinic acids (Total CQAs + diCQAs).
Figure 6. CAs extraction through different beverage preparation methods.
Effect of grain toasting on CAs
As a result of roasting, CAs levels decrease significantly 43,62 meanwhile quinic acid levels tend to increase due to CAs break down.30 According to Tfouni et al. 28, the decrease in CAs levels is attributed to the rupture of covalent bonds between carbon atoms which facilitates isomerization in the early stages of roasting and epimerization, lactonization and degradation in the later stages.
Consequently, the higher the roasting temperature, the lower the CAs levels in the roasted grain.55 According to Flament et al. 46, in C. arabica's roasted coffee beans, there is approximately 4.3% of CAs on dried matter basis. However, in very roasted coffees about 50 to 60% of the initially present CAs are degraded as a result of the high roasting temperatures 46,49 for this reason, in well-roasted coffees (black coffees) CAs are found only in very low quantities.8,60,63
Consequently, the longer the time and the higher the roasting temperature, the lower the CAs concentration in the coffee drink (Figure 7); and the higher the concentration of caffeic acid and other low molecular weight phenolic compounds.2,64
This phenomenon is exemplified by the results reported by Ferraz et al. 65 who studied the CAs degradation during the coffee beans roasting. Their studies revealed that depending on the degree of roasting (temperature vs time), CAs losses can reach up to 99.1% (Table 2).
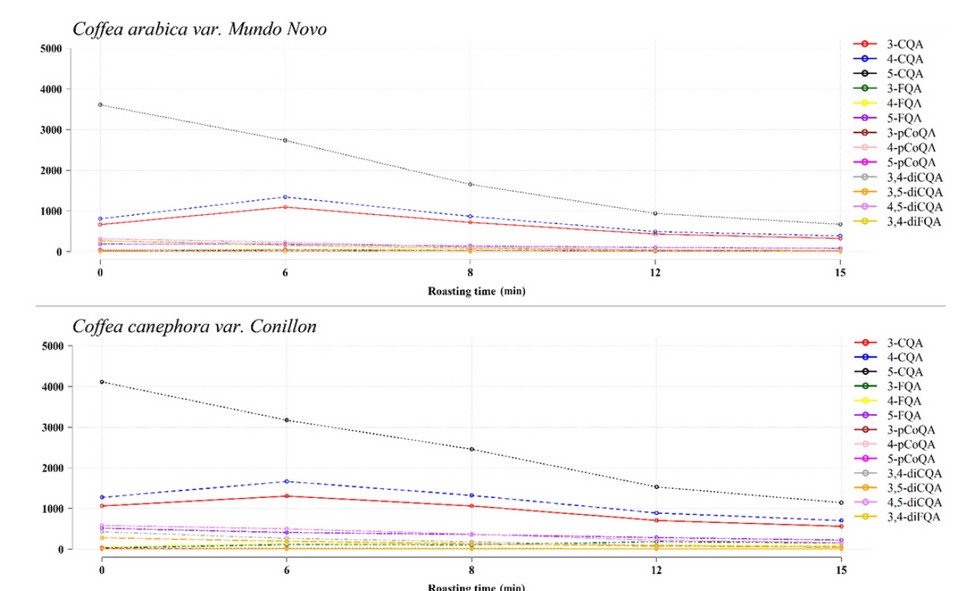
Adapted from Perrone et al. 25. Circles represent means expressed as mg/100 g of coffee on dried basis.
3-caffeoylquinic acid (3-CQA) | 4-caffeoylquinic acid (4-CQA) | 5-caffeoylquinic acid (5-CQA).
3-feruloylquinic acid (3-FQA) | 4-feruloylquinic acid (4-FQA) | 5-feruloylquinic acid (5-FQA).
3-p-coumaroylquinic acid (3-pCoQA) | 4-p-coumaroylquinic acid (4-pCoQA) | 5-p-coumaroylquinic acid (5-pCoQA).
3,4-dicoumaroylquinic acid (3,4-diCoQA) | 3,5-dicoumaroylquinic acid (3,5-diCoQA).
4,5-dicoumaroylquinic acid (4,5-diCoQA) | 3,4-diferuloylquinic acid (3,4-diFQA).
Figure 7. Chlorogenic acid levels at different roasting times (170 °C).
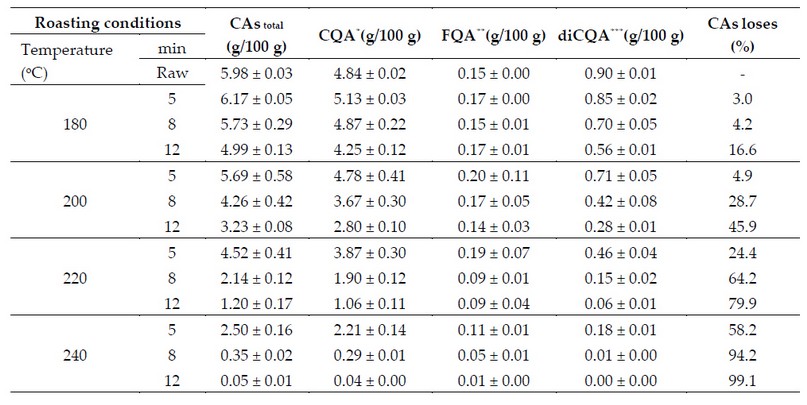
Table 2. CAs content in raw coffee beans and at different roasting levels.
Concomitantly the coffee bean CAs levels are reduced, as a result of their thermal hydrolyzation, a series of aro-matic compounds with a greater or lesser degree of complexity are produced which according to Shibamoto 66 are gen-erally present in the roasted grain in the following concentration gradient: catechol > 4-ethylcatechol > phenol > benzoic acid > 2,5-dimethylfuran > 2-methylcyclohexanone > 1,2-cyclohexadione > furfuryl alcohol > pyridine > 2-cyclohexen-1-one > 3-ethylcatechol > 2-hydroxycinnamic acid > cyclotene > 1-hydroxy-2-propanone > 2-methylpyrazine.
ACs' metabolism
CAs intake varies considerably depending on consumption habits, to the point that it ranges between 100 to 1000 mg per day for moderate and strong consumers, respectively; However, with the increase of instant coffee consumption, this can reach up to 1500 mg per day.34
However, based on the evidence it is known that the greater the amount of ingested CAs, the lesser the amount that will be hydrolyzed and metabolized, presumably, due to an oversaturation of the system,22,34,67 enzymatic limitations, and limitations in the transport mechanisms through the small intestine among other factors.34
Once ingested, CAs remain stable since salivary enzymes and gastric secretions cannot hydrolyze them especially when they interact with dietary proteins forming insoluble complexes resistant to the catabolic action (proteolysis) of digestive enzymes (eg, trypsin, chymotrypsin, pepsin & pancreatin).34
On the other hand, a small fraction is absorbed through the stomach wall via passive diffusion 34,68; meanwhile, the rest continues their journey reaching the small intestine where they are hydrolyzed by the mucous membrane and intestinal microflora 67,69-71 to such degree that only their metabolic derivatives and a small non-catabolized fraction manage to cross the wall of the upper gastrointestinal tract (small intestine) 49,68,70,72 via passive diffusion 34 with an absorption rate of up to 33%. In consequence, the plasma shows only small concentrations of them (Table 3).34,68,71-73
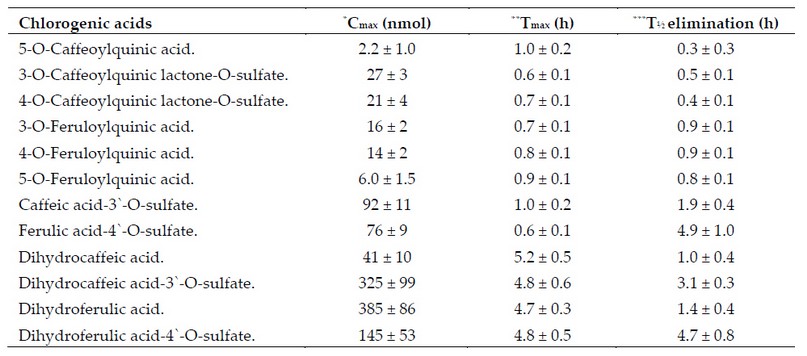
Table 3. ACs pharmacokinetic parameters in blood plasma after the intake of 412 mmol of ACs dissolved in 200 ml of instant coffee.
Once absorbed, a fraction of CAs manages to pass intact to the bloodstream where it interacts with plasma proteins (albumins) forming complexes,34 meanwhile the other fraction and its metabolic derivatives before being excreted through the urine (< 5%) in a free or conjugated form 72 are submitted into a series of hepatic metabolic processes which include methylations and conjugations (eg, sulfatations, and glucuronidations) catalyzed by phase II enzymes (eg, sulfotransferases, and glucuronyl transferases) 34,72,75 which are characterized for being highly polymorphic and display a variable degree of activity.34
Sulfation is a conjugation reaction catalyzed by a sulfotransferase between a molecule and a sulfo group; whereas glucuronidation is a reaction mediated by a glucuronosyltransferase that results in the addition of a glucuronic acid molecule to a given substrate.
For example, SULT 1A1 is a sulfotransferase capable of catalyzing the hepatic transformation of caffeic acid and dihydrocaffeic acids; Additionally, glucuronyl transferases UGT 1A1 & UGT 1A9 catalyze the transformation of hy-droxycinnamic acids.34
As a result, most ingested CAs manage to reach the colon where they are metabolized by a good number of genera that comprise the intestinal microflora (eg, Escherichia coli, Bifidobacterium lactis, Lactobacillus gasseri, Eubacterium sp., Enterococcus sp., Micrococcus sp., Fusobacterium sp., Streptococcus sp., Peptostreptococcus sp., and Chrostridium sp.).34,49,68,76 For this reason, several authors argue that coffee antioxidant capacity is mainly due to α-Tocopherols and vitamin C (ascorbic acid) which reach much higher concentrations and turn out to be more powerful antioxidants than CAs.74
Most CAs (up to 71%) are metabolized at the colon by the intestinal microflora 12,68,73,75 which means that the ester type of bonds that keep the molecules structure are enzymatically broken thus releasing its constituent monomers of lower molecular weight which being conjugated with other compounds, by the action of reductive enzymes, lead to de novo formation of other substances (eg, dihydrocaffeic acid, & dihydroferulic acid) which in turn being also metabolized are conjugated with other compounds (eg, SO4) thus producing molecules that are not originally present in the coffee drink.12
This phenomenon is evidenced by a variety of resulting compounds present in the plasma and urine some of which are considered reliable markers of phenolic compounds intake (Table 3).
The list of metabolites excreted through the urine includes, but is not limited to: caffeic acid, ferulic acid, p-coumaric acid, synaptic acid, gallic acid, 3,4-dihydroxyphenylacetic acid, dihydrocaffeic acid, dihydroferulic acid, 4-hydroxybenzoic acid, 2,4-dihydroxybenzoic acid, isoferulic acid, and m-hydroxyphenyl propionic acid.34
For example, in a study in which the participants ingested two cups of coffee three times a day at intervals of 4 h in between, detected in the urine of the participants the presence of ferulic acid, isoferulic acid, dihydroferulic acid, 3-methoxy-4-hydroxybenzoic acid, hippuric acid, and 3-hydroxyhippuric acid.73
However, the rapid presence of compounds, in plasma, derived from their hydrolysis suggests an early and limited metabolism which probably occurs at the upper gastrointestinal tract where they are hydrolyzed by the action of ester-ases.12,34,72
Finally, concentrations of mono-caffeoylquinic acids (eg, 5-CQA) and mono-feruloylquinic acids (eg, 3-FQA, 4-FQA, & 5-FQA) in plasma followed by an increasing concentration of dihydrocaffeic and dihydroferulic acid after 4-5 h of ingestion (Table 3) provides support for a biphasic metabolism, in other words, one fraction is rapidly absorbed and metabolized at the level of the small intestine while the other one is metabolized and absorbed at the lower gastrointes-tinal tract (colon).12,34
For a more detailed discussion about CAs metabolism read Stalmach 72 & Farah et al. 34.
Roasted coffee's CAs and antioxidant capacity
ACs have antioxidant activity, which confers them properties such as antiviral, antifungal, hypoglycemic,27,55,77 hepa-to-protective, antispasmodic,27,55 anti-bacterial and antihistaminic activity.30,77 There is also pharmacological evidence that demonstrates the antiviral properties of non-volatile phenolic compounds (eg, caffeoylquinic, and dicaffeoylquinic acids) against adenoviruses, the herpes virus,57 HIV virus and human influenza virus.77
CAs antioxidant capacity is conditioned by the hydroxyl groups position within the aromatic ring; For example, 3-CQA has two free hydroxyl groups to donate hydrogens, conversely, the other isomers only have one; As a result, 3-CQA may have a higher antioxidant activity compere to its positional isomers. In recent research, it was reported that 3-CQA has low molecular weight and greater activity against hydroxyl radicals and may be the largest contributor against peroxidic radicals present in concoctions based on green coffee beans.24
CAs are polyphenolic aromatic compounds derived from the phenylpropanoids metabolism 4,6 which tend to be quantified together with other polyphenols present in the sample and expressed as total polyphenols in terms of mg of 3,4,5-trihydroxybenzoic acid (gallic acid) per gram of dried matter.42,44
However, their antioxidant capacity can be expressed in different forms such as milligrams of α-Tocopherol equiv-alent per milliliter of extract (mg Toc/ml), milligrams of ferrous iron (Fe+2) equivalent per milliliter of extract (mg Fe [II]/ml), milligrams of vitamin C equivalent per milliliter of solution,78 and milligrams of Trolox per gram of dried mat-ter.13,69,79,80 Trolox (6-hydroxy-2,5,7,8-tetramethylchroman-2-carboxylic acid) is a synthetic and hydrosoluble analog of vitamin E.
Being reducing agents, CAs block the production of free radicals and prevent the automatic oxidation of lipids via redox reactions, thus preventing the oxidation of low-density lipoprotein (LDL) and very-low-density lipoprotein (VLDL) which in turn delays the development of atherosclerosis in humans.44,67,72,77
In addition, due to their antioxidant properties, CAs are considered potential substitutes of synthetic phenolic compounds with antioxidant properties traditionally used by industry to prevent oxidative food rancidity.81 Among the most commonly used synthetic antioxidants we can cite: butylated hydroxyanisole (BHA [E-320]), butylated hydroxy-toluene (BHT [E-321]), TBHQ, α-Tocopherol (E-307), and last but not least gallate propyl (E-310) 81 which maximum permissible level in food should not exceed 10 μg g-1 of dried matter (Figure 8).
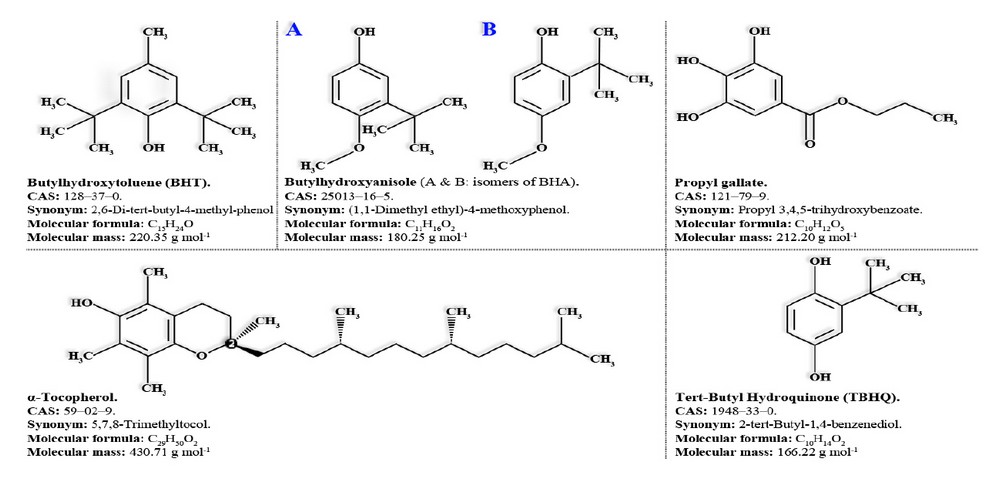
Figure 8. Synthetic phenolic compounds with antioxidant properties.
However, for this to happen, CAs must: be thermo-stable and effective even at low concentrations, toxicologically safe, fat-soluble and easily homogenized, odorless and tasteless so that they do not alter the sensory characteristics of food. Unfortunately, CAs are not thermo-stable, are not fat-soluble, and some of them tend to alter the taste of food by imparting bitter notes.
On the other hand, due to their higher ACs concentration, the beverage prepared from Robusta coffees generally shows a higher antioxidant capacity than that one prepared based on Arabica coffees.24,27,32 In contrast, some authors argue that, since CAs are degraded during roasting regardless of the species involved, the greater antioxidant capacity observed in Robusta coffees is due to their higher caffeine concentration which also has antioxidant capacity and is also thermostable, which means it's not degraded during roasting.64
In general, the higher the temperature and processing time, the lower the CAs levels 10,82 and consequently the lower the beverage's antioxidant capacity; with certain documented exceptions. For instance, Cho et al. (42) reported that lightly roasted coffee (9 min at 240 °C) contained 49% more polyphenols (55 mg of gallic acid equivalent [GAE] per gram of dried matter) than those quantified in unroasted beans (36.93 mg of GAE per gram of dried matter). However, from this point forward a downward gradient was clearly observed when the processing temperature increased: medium roasted (41.49 mg of GAE per gram of dried matter), dark roasted (35.95 mg of GAE per gram of dried matter), and very roasted (26.80 mg of GAE per gram of dried matter).
Similar results were obtained by Somporn et al. 44 who reported an increase in the antioxidant capacity of slightly roasted coffee samples (Table 4). Likewise, the concentration of phenols and the antioxidant capacity of these samples gradually decreased as the roasting level increased.44
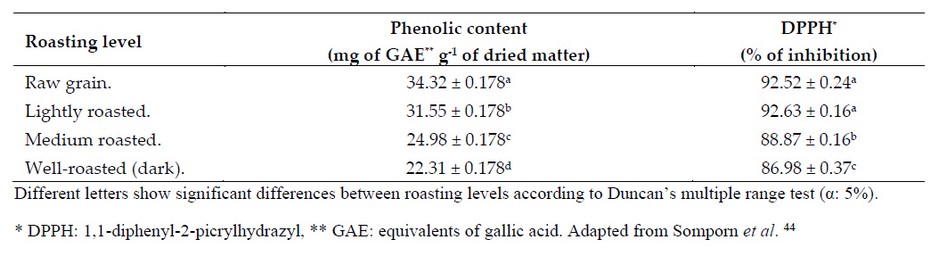
Table 4. Coffee's total phenol content and antioxidant capacity (% inhibition) at different roasting profiles.
Likewise, experiences reported by Perrone et al. 83 provide evidence of increased antioxidant activity, in both species (C. canephora & C. arabica), measured through the ferric reducing antioxidant power assay (FRAP), when coffee samples were slightly roasted. After submitting coffee samples to various levels of processing (ie, 6, 7, 8, 9, 12, & 15 min at 220 °C) a greater antioxidant activity was recorded in the whole coffee brew of slightly roasted grains (6 min) compared to what was observed in raw grains and other roasting levels.83
The sudden increase in coffee's antioxidant capacity through light roasting can be elucidated by the disruption of cellular structures during the pyrolysis facilitating the release of primary antioxidants (eg, low molecular weight phenolic compounds).84 Additionally, due to the increase in temperature, the structure of many primary antioxidants may change resulting in the formation of secondary antioxidants (eg, heterocyclic compounds, and melanoidins) causing the infusion's antioxidant capacity to increase or remain unchanged with respect to the antioxidant capacity of aqueous extracts derived from raw coffee beans.2,24,42,44,84
As the processing temperature increases these compounds tend to be denatured, that is, they are polymerized or self-oxidized, which results in the formation of compounds with lower antioxidant capacity.62,84
From all this, it can be concluded that coffee bean light roasting is the best from a nutritional point of view; However, well-roasted or dark coffees enjoy greater commercialization than light or medium ones.38
Finally, the infusion preparation method also influences the CAs concentration in the coffee beverage and consequently its antioxidant capacity. For instance, it is estimated that an espresso cup contains more CAs than conventionally prepared coffees due to the pressure with which hot water is applied during the extraction of soluble compounds.34
According to Ludwig et al. 74, one cup of espresso coffee contains between 24-423 mg of caffeoylquinic acids; which would explain why espresso-type of coffees (eg, cappuccino, American, etc) have twice the antioxidant capacity compared to what is observed in wine and pomegranate juice.85
Coffee pulp's phenolics
Despite the diversity of phenolic compounds, according to Farah et al. 4, "There are no reports of tannins in the wet coffee beans, but the mesocarp contains 0.8 to 2.8% of hydrolyzable tannins in addition to small amounts of insoluble or condensed tannins". The most important tannins in the coffee mesocarp (pulp) are the proanthocyanidins, which are polymers of flavan-3-ols 86 of relatively high molecular mass and can be hydrolyzable or condensed 4,87 and are characterized by their bitter flavors.
Interestingly, condensed tannins concentrations are higher in varieties with yellowed-skin fruits compared to those with red fruits.27,88 According to De Colmenares et al. 86, coffee pulp's condensed tannins concentration ranges from 0.88 to 1.19% based on dried matter; and the list of them includes, but is not limited to: epicatechin (21.6%), catechin (2.2%), rutinic acid (2.1%), and protocatechuic acid.88
Condensed tannins are secondary metabolites of phenolic nature and high molecular weight, bitter taste, and rich in hydroxyl and carboxylic groups; which can be detected through a colorimetric test.89 These are called proanthocyanidins or procyanidins 90 and belong to the flavonoids class whose chemical structure consists of flavan-3-ol monomers connected to oligomeric or polymeric molecules through β-type bonds (C4→ C8 & C4→ C6) (Figure 9: E, F & G).91 However, α-type links also exist (C2-O-C7 or C2-O-C5).92,93
Proanthocyanidins diversity depends on variations in their chemical configuration caused by the number and arrangement of the hydroxyl groups in rings A and B (Figure 9: B, C & D), types of bonds, degree of polymerization, and the presence of additional substituents (eg, gallic acid).92,94
The condensed tannins polymerization level determines their bio-availability. According to Santos-Buelga et al. 92, tannins with a lower degree of polymerization (ie, dimers, and trimers) are more likely to cross the intestinal wall than more complex polymers.
Tannins also have antioxidant capacity directly related to the hydroxylation pattern. Stabilizing free radicals lies in their ability to donate protons derived from hydroxyl groups attached to their structure; In other words, the more hydroxyl groups coupled to the B ring, the greater their antioxidant capacity. Thus, gallocatechin has a greater antioxidant capacity than catechin.
This chemical trait is limited by the degree of polymerization (DP) since there is evidence of an increasing gradient from monomers to trimers followed by a clear reduction as the DP progresses into higher molecular weights.92 The reduction of antioxidant capacity in high molecular weight molecules is due to the steric hindrance, which decreases the molecule's ability to react with other compounds.
Although condensed tannins confer desirable agronomic traits such as fungal resistance (in vitro inhibition of Hemileia vastatrix spores germination) and insect protection; they also have antinutritional effects since they form complexes with nitrogen-containing compounds (eg, peptides, oligopeptides, polypeptides, and proteins) via hydrophilic and hy-drophobic interactions producing complexes with a greater or lesser hydro-solubility which also tend to precipitate during digestion.87,88,95
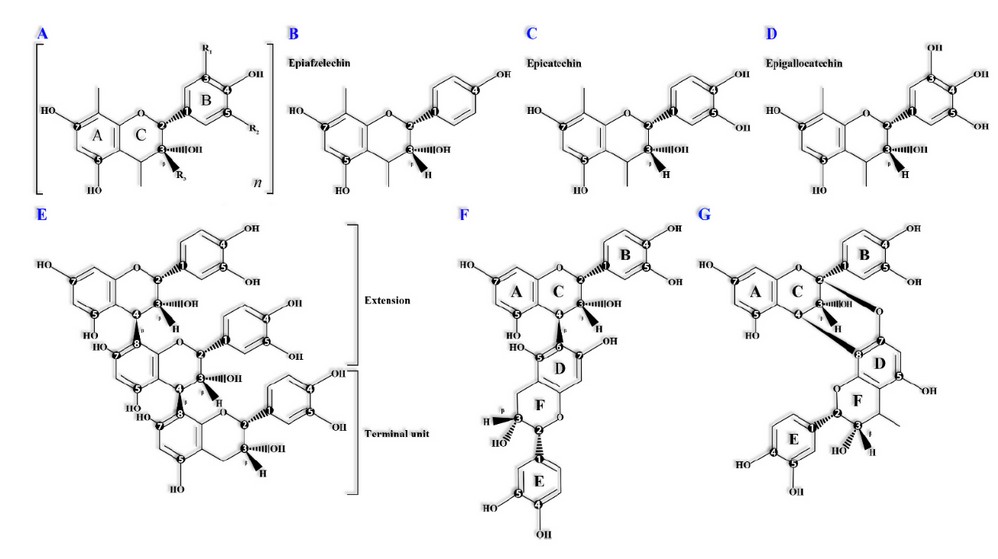
(A) Proanthocyanidins monomeric structure where "n" indicates the degree of polymerization. The letters serve to identify mono or heterocyclic phenolic rings.
(B, C, D) Monomeric structure of propelargonidins, procyanidins and prodelfinidins respectively.
(E) β-Procyanidin trimer showing epicatechin-(4β→ 8)-epicatechin-(4β→ 8)-catechin bond type.
(F) B5 procyanidin molecule showing epicatechin-(4β→ 8)-epicatechin bond type.
(G) Procyanidin A2 molecule showing type A epicatechin-(2β→ O→ 7 & 4β→ 8)-epicatechin bonds between epicatechin mono-mers.
Figure 9. Condensed tannins' monomers and oligomers' chemical configuration.
The tannin-protein complexes formation occurs due to the interaction of phenolic groups, which act as protons donors (H+) and proteins' carbonyl groups which act as receptors.92 For instance, when condensed tannins interact with proline-rich salivary enzymes they cause their precipitation, which is perceived as astringency in the oral cavity; which also increases with tannin DP.86
However, the human diet contains approximately 0.1% of condensed tannins and they do not survive in the human body for long since they are metabolized both by the tissues and the intestinal flora.92
Tannin-protein complexes not only limit the bio-availability and antioxidant action of the phenolic fraction but also causes the protein fraction denaturation through alterations in its secondary and tertiary structure which affects their physiological functions as in the case of enzymes.1
The ability to couple and neutralize enzymes it's of great interest for Phyto-pathologists and Plant breeders since it is a mechanism through which plants protect themselves from digestive enzymes released by invasive fungi 91; However, when condensed tannins of lower molecular weight and lower DP (eg, dimers, and trimers) are absorbed through the intestinal wall they can form complexes with enzymes and other blood proteins (eg, hemoglobin) thus interfering with their physiological functions.
As a result, even when the coffee pulp is a good source of protein (7.5-15.0%), lipids (2.0-7.0%), and carbohydrates (21-32%) 27, its use to feed monogastric or polygastric animals (ruminants) is contraindicated or should be limited 86,88 due to the high condense tannins content (~ 30-60% of pulp extracted polyphenols depending on the organic solvent) and their antinutritional effects.96
Coffee antioxidant capacity determination
Coffee phenolic compounds' antioxidant capacity is measured in vivo or in vitro using the grain's polyphenolic extract instead of individually evaluating each compound.
A good method to assess the antioxidant capacity of given compound measures both: the degree of inhibition and the time of inhibition of the oxidation rate. Therefore, it is challenging to assess polyphenolic compounds' antioxidant capacity based on the results provided by a single approach 97,98 reason why coffee grain extract antioxidant capacity is usually measured through a series of methods or techniques such as but not limited to:
a) 2,20-azino-bis-(3-ethylbenzothiazoline-6-sulfonic acid) a stable free radical better known as ABTS+ used to measure the total antioxidant capacity of a given extract.97,99-101
It is a colorimetric test based on the cation discoloration 102 when interacting with lipophilic or hydrophilic antioxidant compounds.103 Such interactions are based on the exchange of electrons through redox reactions 104 and the results are usually expressed in equivalent mmol or µmol of Trolox per milligram of extract 85,97,99,100,105 or in terms of the ability to neutralize free radicals (Formula 1).
b) 1,1-diphenyl-2-picrilhydrazil (DPPH), and tris(2,4,6-trichloro-3,5-dinitrophenyl) methyl (HNTTM) are usually used to discriminate between the proton donation process (H+) and the electron transfer mechanism.99
DPPH is a stable free radical that exhibits an intense violet coloration when in solution. However, after interacting with other free lipophilic antioxidant radicals or compounds, it is neutralized by turning it into α,α-diphenyl-β-picrylhydrazine, whose color is pale or yellow 106-109, which is considered a visible marker of the compound or solution antioxidant capacity.
The results of this test can be expressed in terms of equivalent mmol or µmol of Trolox per milligram of dried matter,97,105 the ability to neutralize free radicals, or effective concentration (EC50).

The EC50 is expressed in terms of mg ml-1 and is defined as the amount of extract required to reduce the initial absorbance by 50%.22,109 In other words, the lower the EC50, the higher the antioxidant capacity of the extract and vice versa.
However, although ABTS+ and DPPH are typically used, under in vitro conditions, to evaluate the antioxidant capacity of many compounds derived from food matrices, the results are not easily extrapolated to biological systems since such radicals are of a synthetic nature.97,110
In addition, the results obtained by both differ because ABTS+ is able to interact with lipophilic and hydrophilic compounds 85; Conversely, DPPH's capacity is limited to lipophilic compounds. On the other hand, due to ABTS+ tendency to interact with any hydroxylated aromatic compound, it's not possible to discriminate between the antioxidant capacity of polyphenolic compounds per se and that of the Maillard reaction derived compounds such as lactones or melanoidins.104,111
Finally, DPPH interacts only with free antioxidant compounds, that is, those that are not coupled to other molecules forming complexes.103 Consequently, antioxidants coupled to other molecules are unable to interact with DPPH. Therefore, when working with DPPH the result is to be interpreted as a partial or limited estimate of the sample's antioxidant capacity.103
c) β-Carotene/linoleic acid method. When β-Carotene and linoleic acid are jointly water-bath incubated (50 °C), the latter releases hydrogen peroxide (H2O2) ions which promote the oxidation of the former one.112
However, antioxidants in the coffee extract neutralize the free radicals thus preventing the β-Carotene chro-mophore oxidation 108,112 which otherwise oxidizes and, in the process, loses its color.
Consequently, when comparing coffee extracts the one which prevents more efficiently the β-Carotene oxida-tion will be the one with the highest antioxidant activity and thus it is compared with several synthetic antioxidants used as controls or references.
d) Ferric reducing antioxidant power (FRAP). The method is based on a single electron transfer and it is designed to work with biological samples.103,110 This method indirectly estimates a compound's antioxidant capacity because it measures its reducing properties by interacting, in an acidic aqueous solution, with the 2,4,6-tripyridyl ferric triazine complex (Fe+3-TPTZ) 97,101,108 breaking the free radical chain through the donation of a proton (H+).108
The result is the reduction of Fe+3-TPTZ into the blue colored ferrous tripyridyltriazine complex (Fe+2-TPTZ).101,103,108,112 In summary, if the reduction occurs (Fe+3-TPTZ → Fe+2-TPTZ) then the compound's redox capacity is confirmed, which qualifies it as a reducing and antioxidant agent due to its ability to stabilize free radicals through proton donation (H+).108
In addition, the results can be expressed in terms of FeSO4 equivalents per gram of coffee extract based on dried matter 110 or µmol of vitamin C per milligram of dried matter.97
e) Oxygen radical absorbance capacity (ORAC). It's a fluorescent method based on the transference of protons (H+) and measures a substance's antioxidant capacity based on the neutralization of pyroxy radicals.107,110 The results are usually expressed in terms of µmoles of Trolox equivalents per gram of coffee extract on a dried matter base.110,113,114
f) Fourier Transform Infrared Spectroscopy (FTIR). This technique can be used to estimate a sample's total antioxidant capacity and total phenolic compounds based on functional groups' vibration.105 In addition, this technique requires less time during its implementation than previously described approaches.
CONCLUSION
From a chemical point of view, the coffee drink is a complex mixture of organic compounds (eg, caffeine, CAs, melanoidins, diterpene lipids, etc) some of which can exert physiological effects on humans and animals 115; however, the possibility that these effects are the result of their synergistic or antagonistic action cannot be ruled out.
Although its chemical composition includes nutritional compounds, some with bioactive activity, the World Health Organization (WHO) defines coffee as "a non-dietary component" 116; however, it is considered the primary source of dietary antioxidants in industrialized countries (eg, ~ 66% in Brazil, ~ 64% in Norway, ~ 45% in Spain, ~ 56% in Japan) 1,34,49,84,117-120 and it is estimated that the daily consumption of 4 to 5 cups of coffee covers ~ 64 to 66% of the antioxidant dietary requirements.69,121
It can be speculated that the chemo-protective effects of coffee are partly due to its ability to intracellularly neutralize oxidizing agents such as free radicals, many of which are positively charged molecules (eg, NO+, NO-, ONOO-, H2O2, O2-, NO, & OH-) in search of electrons to stabilize.
However, the coffee drink antioxidant capacity is the result of the synergism between several factors such as the content of CAs and other phenolic compounds of lower molecular weight, caffeine and melanoidin content, species/varieties, mixtures made before or after roasting & the degree of roasting.
The evidence suggests that light and medium roasted coffees have a greater antioxidant capacity than black or well-roasted coffees. This is attributed to CAs breakdown during the grain pyrolysis; As a result, it can be inferred that the antioxidant capacity of black or well-roasted coffee is attributed to caffeine and melanoidin content whose concentration increases as the roasting of the grain progresses.
On the other hand, Robusta coffees have a higher antioxidant capacity than Arabica coffees due to higher CAs content. Unfortunately, the quality of the coffee cup is negatively affected by the high CAs concentrations, which is why Robusta coffees are often rated as inferior, and their price is punished in the international market.
In summary, although a higher CAs concentration is nutritionally favorable, a balance should be sought, since in excess it not only affects the drink quality but also they are not used efficiently due to an oversaturation of the enzymatic transport system in the upper intestinal tract.
This balance can be achieved by controlling the proportions between Arabica and Robusta coffees blends before or after roasting, the roasting point, and eliminating the poor quality beans, that is, the green or immature beans because they contain more CAs than the mature ones, the over fermented beans and those with black or oxidized cuticle because they contain up to 25% more 3-caffeoylquinic acid, 4-caffeoylquinic acid, and 4-feruloylquinic acid compared to good quality grains 4 thus causing an increase in the drink acidity.11
Funding: This research received no external funding.
Acknowledgments
The authors thank the Office for the Scientific, Humanistic and Technological Research (DICIHT) of the National Au-tonomous University of Honduras for their sponsorship during the publication of this article.
Conflicts of Interest: The authors declare no conflict of interest.
REFERENCES
1. Bandyopadhyay P.; Ghosh A.K.; Ghosh C. Recent developments on polyphenol-protein interactions: effects on tea and coffee taste, antioxidant properties and the digestive system. Food Funct. 2012;3(6):592-605. doi: 10.1039/c2fo00006g.
2. Cheng B.; Furtado A.; Smyth H.E.; Henry R.J. Influence of genotype and environment on coffee quality. Trends Food Sci Technol. 2016; 57:20-30. doi: 10.1016/j.tifs.2016.09.003.
3. Joet T.; Salmona J.; Laffargue A.; Descroix F.; Dussert S. Use of the growing environment as a source of variation to identify the quantitative trait transcripts and modules of co-expressed genes that determine chlorogenic acid accumulation. Plant Cell Environ. 2010;33(7):1220-33. doi: 10.1111/j.1365-3040.2010.02141.x.
4. Farah A.; Donangelo C.M. Phenolic compounds in coffee. Braz J Plant Physiol. 2006;18(1):23-36. doi: 10.1590/s1677-04202006000100003.
5. Esposito F.; Morisco F.; Verde V.; Ritieni A.; Alezio A.; Caporaso N., et al. Moderate coffee consumption increases plasma glutathione but not homocysteine in healthy subjects. Aliment Pharmacol Ther. 2003;17(4):595-601. doi: 10.1046/j.1365-2036.2003.01429.x.
6. Mishra M.K.; Slater A. Recent advances in the genetic transformation of coffee. Biotechnol Res Int. 2012;2012:580857. doi: 10.1155/2012/580857.
7. Dessalegn Y.; Labuscagne M.T.; Osthoff G.; Herselman L. Variation of green bean caffeine, chlorogenic acid, sucrose and trigolline contents among Ethiopian Arabica coffee accessories. SINET: Ethiop J Sci. 2008;30(1):77-82. doi: 10.4314/sinet.v30i1.18286.
8.Wang X.; Lim L.-T. Physicochemical characteristics of roasted coffee. In: Coffee in health and disease prevention. Academic Press: San Diego; 2015. p. 247-54. doi: 10.1016/b978-0-12-409517-5.00027-9.
9. Somporn C.; Kamtuo A.; Theerakulpisut P.; Siriamornpun S. Effect of shading on yield, sugar content, phenolic acids and antioxidant property of coffee beans (Coffea arabica L. cv. Catimor) harvested from north-eastern Thailand. J Sci Food Agric. 2012;92(9):1956-63. doi: 10.1002/jsfa.5568.
10. Narita Y.; Inouye K. Chlorogenic acids from coffee. In: Coffee in health and disease prevention. Academic Press: San Diego; 2015. p. 189-99. doi: 10.1016/b978-0-12-409517-5.00021-8.
11.Wei F.; Tanokura M. Organic compounds in green coffee beans. In: Coffee in health and disease prevention. Academic Press: San Diego; 2015. p. 149-62. doi: 10.1016/b978-0-12-409517-5.00017-6.
12. Cano-Marquina A.; Tarin J.J.; Cano A. The impact of coffee on health. Maturitas. 2013;75(1):7-21. doi: 10.1016/j.maturitas.2013.02.002.
13. Ludwig I.A.; Sanchez L.; Caemmerer B.; Kroh L.W.; De Peña M.P.; Cid C. Extraction of coffee antioxidants: impact of brewing time and method. Food Res Int. 2012;48(1):57-64. doi: 10.1016/j.foodres.2012.02.023.
14. Poisson L.; Blank I.; Dunkel A.; Hofmann T. The chemistry of roasting - Decoding flavor formation. In: The craft and science of coffee. Folmer B, editor. Academic Press: 2017. p. 273-309. doi: 10.1016/b978-0-12-803520-7.00012-8.
15. Weng J.K.; Chapple C. The origin and evolution of lignin biosynthesis. New Phytol. 2010;187(2):273-85. doi: 10.1111/j.1469-8137.2010.03327.x.
16. Oestreich-Janzen S. Chemistry of coffee. In: Comprehensive natural products II. Elsevier: Oxford; 2010. p. 1085-117. doi: 10.1016/b978-008045382-8.00708-5.
17. Komes D.; Bušić A. Antioxidants in coffee. In: Processing and impact on antioxidants in beverages. Preedy V, editor. Academic Press: San Diego; 2014. p. 25-32. doi: 10.1016/b978-0-12-404738-9.00003-9.
18.Tran H.T.; Lee L.S.; Furtado A.; Smyth H.; Henry R.J. Advances in genomics for the improvement of quality in coffee. J Sci Food Agric. 2016;96(10):3300-12. doi: 10.1002/jsfa.7692.
19. Benatti L.B.; Silvarolla M.B.; Mazzafera P. Characterisation of AC1: a naturally decaffeinated coffee. Bragantia. 2012;71(2):143-54. doi: 10.1590/s0006-87052012000200001.
20. Baumann T.W. Some thoughts on the physiology of caffeine in coffee: and a glimpse of metabolite profiling. Braz J Plant Physiol. 2006;18(1):243-51. doi: 10.1590/s1677-04202006000100017.
21. Joet T.; Laffargue A.; Salmona J.; Doulbeau S.; Descroix F.; Bertrand B., et al. Metabolic pathways in tropical dicotyledonous albuminous seeds: Coffea arabica as a case study. New Phytol. 2009;182(1):146-62. doi: 10.1111/j.1469-8137.2008.02742.x.
22. Dziki D.; Gawlik-Dziki U.; Pecio Ł.; Różyło R.; Świeca M.; Krzykowski A., et al. Ground green coffee beans as a functional food supplement - preliminary study. LWT - Food Science and Technology. 2015;63(1):691-99. doi: 10.1016/j.lwt.2015.03.076.
23. Gichimu B.M.; Gichuru E.K.; Mamati G.E.; Nyende A.B. Biochemical composition within Coffea arabica cv. Ruiru 11 and its relationship with cup quality. J Food Res. 2014;3(3):31-44. doi: 10.5539/jfr.v3n3p31.
24. Castillo M.D.d.; Gordon M.H.; Ames J.M. Peroxyl radical-scavenging activity of coffee brews. Eur Food Res Technol. 2005;221(3-4):471-77. doi: 10.1007/s00217-005-1209-1.
25. Perrone D.; Farah A.; Donangelo C.M.; de Paulis T.; Martin P.R. Comprehensive analysis of major and minor chlorogenic acids and lactones in economically relevant Brazilian coffee cultivars. Food Chem. 2008;106(2):859-67. doi: 10.1016/j.foodchem.2007.06.053.
26. Chu Y.F.; Hu K.; Hatzold T.; Black R.M.; Chen D. Flaking process increases the NF-kappaB inhibition activity and melanoidin extractability of coffee. Food Sci Nutr. 2013;1(5):363-68. doi: 10.1002/fsn3.19.
27. Esquivel P.; Jiménez V.M. Functional properties of coffee and coffee by-products. Food Res Int. 2012;46(2):488-95. doi: 10.1016/j.foodres.2011.05.028.
28. Tfouni S.A.V.; Serrate C.S.; Carreiro L.B.; Camargo M.C.R.; Teles C.R.A.; Cipolli K.M.V.A.B., et al. effect of roasting on chlorogenic acids, caffeine and polycyclic aromatic hydrocarbons levels in two Coffea cultivars: Coffea arabica cv. Catuaí Amarelo IAC-62 and Coffea canephora cv. Apoatã IAC-2258. Int J Food Sci Technol. 2012;47(2):406-15. doi: 10.1111/j.1365-2621.2011.02854.x.
29. Noirot M.; Poncet V.; Barre P.; Hamon P.; Hamon S.; De Kochko A. Genome size variations in diploid African Coffea species. Ann Bot. 2003;92(5):709-14. doi: 10.1093/aob/mcg183.
30. Caprioli G.; Cortese M.; Sagratini G.; Vittori S. The influence of different types of preparation (espresso and brew) on coffee aroma and main bioactive constituents. Int J Food Sci Nutr. 2015;66(5):505-13. doi: 10.3109/09637486.2015.1064871.
31. Mills C.E.; Oruna-Concha M.J.; Mottram D.S.; Gibson G.R.; Spencer J.P. The effect of processing on chlorogenic acid content of commercially available coffee. Food Chem. 2013;141(4):3335-40. doi: 10.1016/j.foodchem.2013.06.014.
32. López-Galilea I.; Andueza S.; Leonardo I.d.; Paz de Peña M.; Cid C. Influence of torrefacto roast on antioxidant and pro-oxidant activity of coffee. Food Chem. 2006;94(1):75-80. doi: 10.1016/j.foodchem.2004.10.052.
33. Rostagno M.A.; Celeghini R.M.S.; Debien I.C.N.; Nogueira G.C.; Meireles M.A.A. Phenolic compounds in coffee compared to other beverages. In: Coffee in health and disease prevention. Academic Press: San Diego; 2015. p. 137-42. doi: 10.1016/b978-0-12-409517-5.00015-2.
34. Farah A.; Duarte G. Bioavailability and metabolism of chlorogenic acids from coffee. In: Coffee in health and disease prevention. Academic Press: San Diego; 2015. p. 789-801. doi: 10.1016/b978-0-12-409517-5.00087-5.
35. Marin C.; Puerta Q. G.I. Contenido de ácidos clorogénicos en granos de Coffea arabica L. y C. canephora según el desarrollo del fruto. Cenicafé. 2008;59(1):7-28. doi: http://hdl.handle.net/10778/60.
36. Mehari B.; Redi-Abshiro M.; Chandravanshi B.S.; Combrinck S.; Atlabachew M.; McCrindle R. Profiling of phenolic compounds using UPLC–MS for determining the geographical origin of green coffee beans from Ethiopia. J Food Compost Anal. 2016;45:16-25. doi: 10.1016/j.jfca.2015.09.006.
37. Rodrigues N.P.; Bragagnolo N. Identification and quantification of bioactive compounds in coffee brews by HPLC–DAD–MSn. J Food Compost Anal. 2013;32(2):105-15. doi: 10.1016/j.jfca.2013.09.002.
38. Farah A.; de Paulis T.; Moreira D.P.; Trugo L.C.; Martin P.R. Chlorogenic acids and lactones in regular and water-decaffeinated arabica coffees. J Agric Food Chem. 2006;54(2):374-81. doi: 10.1021/jf0518305.
39. Vaast P.; Bertrand B.; Perriot J.-J.; Guyot B.; Génard M. Fruit thinning and shade improve bean characteristics and beverage quality of coffee (Coffea arabica L.) under optimal conditions. J Sci Food Agric. 2006;86(2):197-204. doi: 10.1002/jsfa.2338.
40. Samanidou V.F. Determination of polyphenols and major purine alkaloids in coffee. In: Coffee in health and disease prevention. Academic Press: San Diego; 2015. p. 971-81. doi: 10.1016/b978-0-12-409517-5.00107-8.
41. Belay A.; Gholap A. Characterization and determination of chlorogenic acids (CGA) in coffee beans by UV-Vis spectroscopy. African Journal of Pure and Applied Chemistry. 2009;3(11):34-240. doi: https://goo.gl/KnnqRW.
42. Cho A.R.; Park K.W.; Kim K.M.; Kim S.Y.; Han J. Influence of roasting conditions on the antioxidant characteristics of Colombian coffee (Coffea arabica L.) beans. J Food Biochem. 2014;38(3):271-80. doi: 10.1111/jfbc.12045.
43. Schrader K.; Kiehne A.; Engelhardt U.H.; Gerhard Maier H. Determination of chlorogenic acids with lactones in roasted coffee. J Sci Food Agric. 1996;71(3):392-98. doi: 10.1002/(sici)1097-0010(199607)71:3<392::Aid-jsfa597>3.0.Co;2-x.
44. Somporn C.; Kamtuo A.; Theerakulpisut P.; Siriamornpun S. Effects of roasting degree on radical scavenging activity, phenolics and volatile compounds of Arabica coffee beans (Coffea arabica L. cv. Catimor). Int J Food Sci Technol. 2011;46(11):2287-96. doi: 10.1111/j.1365-2621.2011.02748.x.
45. Schenker S.; Rothgeb T. The Roast - Creating the beans' signature. In: The craft and science of coffee. Folmer B, editor. Academic Press: 2017. p. 245-71. doi: 10.1016/b978-0-12-803520-7.00011-6.
46. Flament I.; Bessière-Thomas Y. Coffee flavor chemistry. 1 ed. John Wiley & Sons: West Sussex, ΡΟ19 1UD, England; 2001 November. doi: NO_DOI.
47. Lee L.W.; Cheong M.W.; Curran P.; Yu B.; Liu S.Q. Coffee fermentation and flavor--an intricate and delicate relationship. Food Chem. 2015;185:182-91. doi: 10.1016/j.foodchem.2015.03.124.
48. Siebert M.; Berger R.G.; Nieter A. Enzymatic mitigation of 5-O-chlorogenic acid for an improved digestibility of coffee. Food Chem. 2018;258:124-28. doi: 10.1016/j.foodchem.2018.03.061.
49. Miller M.G.; Shukitt-Hale B. Coffee and Alzheimer's disease: animal and cellular evidence. In: Coffee. Chu Y-F, editor. Wiley-Blackwell: Oxford, UK; 2012. p. 77-96. doi: 10.1002/9781119949893.ch4.
50. Čížková H.; Soukupová V.; Voldřich M.; Ševčík R. Differentiation of coffee varieties according to their sterolic profile. J Food Nutr Res. 2007;46(1):28-34. doi: https://goo.gl/9GCr9c.
51. Rocha S.; Maeztu L.; Barros A.; Cid C.; Coimbra M.A. Screening and distinction of coffee brews based on headspace solid phase microextraction/gas chromatography/principal component analysis. J Sci Food Agric. 2004;84(1):43-51. doi: 10.1002/jsfa.1607.
52. Kreuml M.T.; Majchrzak D.; Ploederl B.; Koenig J. Changes in sensory quality characteristics of coffee during storage. Food Sci Nutr. 2013;1(4):267-72. doi: 10.1002/fsn3.35.
53. Downey G.; Boussion J. Authentication of coffee bean variety by near-infrared reflectance spectroscopy of dried extract. J Sci Food Agric. 1996;71(1):41-49. doi: 10.1002/(sici)1097-0010(199605)71:1<41::Aid-jsfa546>3.0.Co;2-i.
54. Cramer P.J.S. A review of literature of coffee research in Indonesia. Inter-American Institute of Agricultural Sciences: Turrialba, Costa Rica; 1957 December. 262 p. doi: NO_DOI.
55. Tfouni S.A.V.; Carreiro L.B.; Teles C.R.A.; Furlani R.P.Z.; Cipolli K.M.V.A.B.; Camargo M.C.R. Caffeine and chlorogenic acids intake from coffee brew: influence of roasting degree and brewing procedure. Int J Food Sci Technol. 2014;49(3):747-52. doi: 10.1111/ijfs.12361.
56. Pacetti D.; Lucci P.; Frega N.G. Unsaponifiable matter of coffee. In: Coffee in Health and Disease Prevention. Academic Press: San Diego; 2015. p. 119-27. doi: 10.1016/b978-0-12-409517-5.00013-9.
57. Farah A. Coffee constituents. In: Coffee. 1 ed. Chu Y-F, editor. Wiley-Blackwell: Oxford, UK; 2012. p. 21-58. doi: 10.1002/9781119949893.ch2.
58. Campa C.; Ballester J.F.; Doulbeau S.; Dussert S.; Hamon S.; Noirot M. Trigonelline and sucrose diversity in wild Coffea species. Food Chem. 2004;88(1):39-43. doi: 10.1016/j.foodchem.2004.01.020.
59. Frega N.G.; Pacetti D.; Mozzon M.; Balzano M. Authentication of coffee blends. In: Coffee in health and disease prevention. Academic Press: San Diego; 2015. p. 107-15. doi: 10.1016/b978-0-12-409517-5.00012-7.
60. Sunarharum W.B.; Williams D.J.; Smyth H.E. Complexity of coffee flavor: a compositional and sensory perspective. Food Res Int. 2014;62:315-25. doi: 10.1016/j.foodres.2014.02.030.
61. Bravo J.; Juaniz I.; Monente C.; Caemmerer B.; Kroh L.W.; De Pena M.P., et al. Evaluation of spent coffee obtained from the most common coffeemakers as a source of hydrophilic bioactive compounds. J Agric Food Chem. 2012;60(51):12565-73. doi: 10.1021/jf3040594.
62. Cämmerer B.; Kroh L.W. Antioxidant activity of coffee brews. Eur Food Res Technol. 2006;223(4):469-74. doi: 10.1007/s00217-005-0226-4.
63. Wang X.; Lim L.T. Investigation of CO2 precursors in roasted coffee. Food Chem. 2017;219:185-92. doi: 10.1016/j.foodchem.2016.09.095.
64. Vignoli J.A.; Viegas M.C.; Bassoli D.G.; Benassi M.d.T. Roasting process affects differently the bioactive compounds and the antioxidant activity of arabica and robusta coffees. Food Res Int. 2014;61:279-85. doi: 10.1016/j.foodres.2013.06.006.
65. Ferraz M.B.M.; Farah A.; Iamanaka B.T.; Perrone D.; Copetti M.V.; Marques V.X., et al. Kinetics of ochratoxin A destruction during coffee roasting. Food Control. 2010;21(6):872-77. doi: 10.1016/j.foodcont.2009.12.001.
66. Shibamoto T. Volatile chemicals from thermal degradation of less volatile coffee components. In: Coffee in health and disease prevention. Academic Press: San Diego; 2015. p. 129-35. doi: 10.1016/b978-0-12-409517-5.00014-0.
67. Agudelo-Ochoa G.M.; Pulgarin-Zapata I.C.; Velasquez-Rodriguez C.M.; Duque-Ramirez M.; Naranjo-Cano M.; Quintero-Ortiz M.M., et al. Coffee consumption increases the antioxidant capacity of plasma and has no effect on the lipid profile or vascular function in healthy adults in a randomized controlled trial. J Nutr. 2016;146(3):524-31. doi: 10.3945/jn.115.224774.
68. Stefanello N.; Spanevello R.M.; Passamonti S.; Porciuncula L.; Bonan C.D.; Olabiyi A.A., et al. Coffee, caffeine, chlorogenic acid, and the purinergic system. Food Chem Toxicol. 2019;123:298-313. doi: 10.1016/j.fct.2018.10.005.
69. Parras P.; Martineztome M.; Jimenez A.; Murcia M. Antioxidant capacity of coffees of several origins brewed following three different procedures. Food Chem. 2007;102(3):582-92. doi: 10.1016/j.foodchem.2006.05.037.
70. Napolitano A.; Panzella L. The chemistry of coffee furans and hydroxycinnamates under simulated gastric conditions. In: Coffee in health and disease prevention. Academic Press: San Diego; 2015. p. 877-86. doi: 10.1016/b978-0-12-409517-5.00097-8.
71. Zuorro A.; Lavecchia R. Spent coffee grounds as a valuable source of phenolic compounds and bioenergy. J Clean Prod. 2012; 34:49-56. doi: 10.1016/j.jclepro.2011.12.003.
72. Stalmach A. Bioavailability of coffee chlorogenic acids. In: Coffee. Chu Y-F, editor. Wiley-Blackwell: Oxford, UK; 2012. p. 59-76. doi: 10.1002/9781119949893.ch3.
73. Salomone F.; Galvano F.; Li Volti G. Molecular bases underlying the hepatoprotective effects of coffee. Nutrients. 2017;9(1). doi: 10.3390/nu9010085.
74. Ludwig I.A.; Clifford M.N.; Lean M.E.; Ashihara H.; Crozier A. Coffee: biochemistry and potential impact on health. Food Funct. 2014;5(8):1695-717. doi: 10.1039/c4fo00042k.
75. Rodrigues N.P.; Toledo Benassi M.; Bragagnolo N. Scavenging capacity of coffee brews against oxygen and nitrogen reactive species and the correlation with bioactive compounds by multivariate analysis. Food Res Int. 2014;61:228-35. doi: 10.1016/j.foodres.2013.09.028.
76. Woodward G.M. The potential effect of excessive coffee consumption on nicotine metabolism: CYP2A6 inhibition by caffeic acid and quercetin. Bioscience Horizons. 2008;1(2):98-103. doi: 10.1093/biohorizons/hzn021.
77. Mussatto S.I. Generating biomedical polyphenolic compounds from spent coffee or silverskin. In: Coffee in health and disease prevention. Academic Press: San Diego; 2015. p. 93-106. doi: 10.1016/b978-0-12-409517-5.00011-5.
78. Ribeiro V.S.; Leitão A.E.; Ramalho J.C.; Lidon F.C. Chemical characterization and antioxidant properties of a new coffee blend with cocoa, coffee silverskin and green coffee minimally processed. Food Res Int. 2014;61:39-47. doi: 10.1016/j.foodres.2014.05.003.
79. Andrade K.S.; Gonçalvez R.T.; Maraschin M.; Ribeiro-do-Valle R.M.; Martínez J.; Ferreira S.R.S. Supercritical fluid extraction from spent coffee grounds and coffee husks: antioxidant activity and effect of operational variables on extract composition. Talanta. 2012;88:544-52. doi: 10.1016/j.talanta.2011.11.031.
80. Ludwig I.A.; Sánchez L.; De Peña M.P.; Cid C. Contribution of volatile compounds to the antioxidant capacity of coffee. Food Res Int. 2014;61:67-74. doi: 10.1016/j.foodres.2014.03.045.
81. Cha M.N.; Kim H.J.; Kim B.G.; Ahn J.H. Synthesis of chlorogenic acid and p-coumaroyl shikimates from glucose using engineered Escherichia coli. J Microbiol Biotechnol. 2014;24(8):1109-17. doi: 10.4014/jmb.1403.03033.
82. Reineccius G. Natural flavoring materials. In: Source book of flavors. Reineccius G, editor. Springer US: Boston, MA; 1995. p. 176-364. doi: 10.1007/978-1-4615-7889-5_7.
83. Perrone D.; Farah A.; Donangelo C.M. Influence of coffee roasting on the incorporation of phenolic compounds into melanoidins and their relationship with antioxidant activity of the brew. J Agric Food Chem. 2012;60(17):4265-75. doi: 10.1021/jf205388x.
84. Sacchetti G.; Di Mattia C.; Pittia P.; Mastrocola D. Effect of roasting degree, equivalent thermal effect and coffee type on the radical scavenging activity of coffee brews and their phenolic fraction. J Food Eng. 2009;90(1):74-80. doi: 10.1016/j.jfoodeng.2008.06.005.
85. Jeszka-Skowron M.; Stanisz E.; De Peña M.P. Relationship between antioxidant capacity, chlorogenic acids and elemental composition of green coffee. Lwt. 2016;73:243-50. doi: 10.1016/j.lwt.2016.06.018.
86. De Colmenares N.G.; Ramírez-Martínez J.R.; Aldana J.O.; Clifford M.N. Analysis of proanthocyanidins in coffee pulp. J Sci Food Agric. 1994;65(2):157-62. doi: 10.1002/jsfa.2740650206.
87. van Dam J.E.G.; Harmsen P. Coffee residues utilization. Report. Wageningen UR Food & Biobased Research, VLAG, Technology FBBNF; 2010. Disponible en: NO_DOI.
88. Pandey A.; Soccol C.R.; Nigam P.; Brand D.; Mohan R.; Roussos S. Biotechnological potential of coffee pulp and coffee husk for bioprocesses. Biochem Eng J. 2000;6(2):153-62. doi: 10.1016/s1369-703x(00)00084-x.
89. Mussatto S.I.; Ballesteros L.F.; Martins S.; Teixeira J.A. Extraction of antioxidant phenolic compounds from spent coffee grounds. Sep Purif Technol. 2011;83(Supplement C):173-79. doi: 10.1016/j.seppur.2011.09.036.
90. Dykes L.; Rooney L.W. Sorghum and millet phenols and antioxidants. J Cereal Sci. 2006;44(3):236-51. doi: 10.1016/j.jcs.2006.06.007.
91. de Colmenares N.G.; Ramírez-Martínez J.R.; Aldana J.O.; Ramos-Niño M.E.; Clifford M.N.; Pékerar S., et al. Isolation, characterisation and determination of biological activity of coffee proanthocyanidins. J Sci Food Agric. 1998;77(3):368-72. doi: 10.1002/(sici)1097-0010(199807)77:3<368::Aid-jsfa52>3.0.Co;2-v.
92. Santos-Buelga C.; Scalbert A. Proanthocyanidins and tannin-like compounds - nature, occurrence, dietary intake and effects on nutrition and health. J Sci Food Agric. 2000;80(7):1094-117. doi: 10.1002/(sici)1097-0010(20000515)80:7<1094::Aid-jsfa569>3.0.Co;2-1.
93. Appeldoorn M.M. Dietary A- and B-type procyanidins: characterization and biofunctional potential of an abundant and diverse group of phenolics [Dissertation]. S.n.: [S.l.; 2009. doi: https://goo.gl/nNgWkf.
94. Zhang S.J.; Lin Y.M.; Zhou H.C.; Wei S.D.; Lin G.H.; Ye G.F. Antioxidant tannins from stem bark and fine root of Casuarina equisetifolia. Molecules. 2010;15(8):5658-70. doi: 10.3390/molecules15085658.
95. Duodu K.G.; Taylor J.R.N.; Belton P.S.; Hamaker B.R. Factors affecting sorghum protein digestibility. J Cereal Sci. 2003;38(2):117-31. doi: 10.1016/s0733-5210(03)00016-x.
96. Rolz C.; De Leon R.; De Arriola M.C. Solid substrate growth of white rot fungi on coffee pulp. Acta Biotechnol. 1988;8(3):211-23. doi: 10.1002/abio.370080302.
97. Schinella G.; Mosca S.; Cienfuegos-Jovellanos E.; Pasamar M.Á.; Muguerza B.; Ramón D., et al. Antioxidant properties of polyphenol-rich cocoa products industrially processed. Food Res Int. 2010;43(6):1614-23. doi: 10.1016/j.foodres.2010.04.032.
98. Ballesteros L.F.; Teixeira J.A.; Mussatto S.I. Chemical, functional, and structural properties of spent coffee grounds and coffee silverskin. Food Bioproc Tech. 2014;7(12):3493-503. doi: 10.1007/s11947-014-1349-z.
99. Corcuera L.A.; Amezqueta S.; Arbillaga L.; Vettorazzi A.; Tourino S.; Torres J.L., et al. A polyphenol-enriched cocoa extract reduces free radicals produced by mycotoxins. Food Chem Toxicol. 2012;50(3-4):989-95. doi: 10.1016/j.fct.2011.11.052.
100. Pedan V.; Fischer N.; Rohn S. An online NP-HPLC-DPPH method for the determination of the antioxidant activity of condensed polyphenols in cocoa. Food Res Int. 2016;89(Part 2):890-900. doi: 10.1016/j.foodres.2015.10.030.
101. Li L.; Zhang S.; Cui Y.; Li Y.; Luo L.; Zhou P., et al. Preparative separation of cacao bean procyanidins by high-speed counter-current chromatography. J Chromatogr B Analyt Technol Biomed Life Sci. 2016;1036-1037(Supplement C):10-19. doi: 10.1016/j.jchromb.2016.09.030.
102. Gniechwitz D.; Reichardt N.; Ralph J.; Blaut M.; Steinhart H.; Bunzel M. Isolation and characterisation of a coffee melanoidin fraction. J Sci Food Agric. 2008;88(12):2153-60. doi: 10.1002/jsfa.3327.
103. Belščak A.; Komes D.; Horžić D.; Ganić K.K.; Karlović D. Comparative study of commercially available cocoa products in terms of their bioactive composition. Food Res Int. 2009;42(5-6):707-16. doi: 10.1016/j.foodres.2009.02.018.
104. Caporaso N.; Genovese A.; Canela M.D.; Civitella A.; Sacchi R. Neapolitan coffee brew chemical analysis in comparison to espresso, moka and American brews. Food Res Int. 2014;61:152-60. doi: 10.1016/j.foodres.2014.01.020.
105. Batista N.N.; de Andrade D.P.; Ramos C.L.; Dias D.R.; Schwan R.F. Antioxidant capacity of cocoa beans and chocolate assessed by FTIR. Food Res Int. 2016;90(Supplement C):313-19. doi: 10.1016/j.foodres.2016.10.028.
106. Moreira M.E.d.C.; Pereira R.G.F.A.; Dias D.F.; Gontijo V.S.; Vilela F.C.; de Moraes G.d.O.I., et al. Anti-inflammatory effect of aqueous extracts of roasted and green Coffea arabica L. J Funct Foods. 2013;5(1):466-74. doi: 10.1016/j.jff.2012.12.002.
107. Ramalakshmi K.; Rao L.J.M.; Takano-Ishikawa Y.; Goto M. Bioactivities of low-grade green coffee and spent coffee in different in vitro model systems. Food Chem. 2009;115(1):79-85. doi: 10.1016/j.foodchem.2008.11.063.
108. Othman A.; Ismail A.; Abdul Ghani N.; Adenan I. Antioxidant capacity and phenolic content of cocoa beans. Food Chem. 2007;100(4):1523-30. doi: 10.1016/j.foodchem.2005.12.021.
109. Hernández-Hernández C.; Viera-Alcaide I.; Morales-Sillero A.M.; Fernández-Bolaños J.; Rodríguez-Gutiérrez G. Bioactive compounds in Mexican genotypes of cocoa cotyledon and husk. Food Chem. 2018;240(Supplement C):831-39. doi: 10.1016/j.foodchem.2017.08.018.
110. Cádiz-Gurrea M.L.; Lozano-Sanchez J.; Contreras-Gámez M.; Legeai-Mallet L.; Fernández-Arroyo S.; Segura-Carretero A. Isolation, comprehensive characterization and antioxidant activities of Theobroma cacao extract. J Funct Foods. 2014;10(Supplement C):485-98. doi: 10.1016/j.jff.2014.07.016.
111. Abrahão F.R.; Rocha L.C.R.; Santos T.A.; Carmo E.L.d.; Pereira L.A.S.; Borges S.V., et al. Microencapsulation of bioactive compounds from espresso spent coffee by spray drying. Lwt. 2019;103:116-24. doi: 10.1016/j.lwt.2018.12.061.
112. Sarmadi B.; Ismail A.; Hamid M. Antioxidant and angiotensin converting enzyme (ACE) inhibitory activities of cocoa (Theobroma cacao L.) autolysates. Food Res Int. 2011;44(1):290-96. doi: 10.1016/j.foodres.2010.10.017.
113. de Oliveira T.B.; Genovese M.I. Chemical composition of cupuassu (Theobroma grandiflorum) and cocoa (Theobroma cacao) liquors and their effects on streptozotocin-induced diabetic rats. Food Res Int. 2013;51(2):929-35. doi: 10.1016/j.foodres.2013.02.019.
114. Carrillo L.C.; Londoño-Londoño J.; Gil A. Comparison of polyphenol, methylxanthines and antioxidant activity in Theobroma cacao beans from different cocoa-growing areas in Colombia. Food Res Int. 2014;60(Supplement C):273-80. doi: 10.1016/j.foodres.2013.06.019.
115. Kennedy O.J.; Roderick P.; Buchanan R.; Fallowfield J.A.; Hayes P.C.; Parkes J. Systematic review with meta-analysis: coffee consumption and the risk of cirrhosis. Aliment Pharmacol Ther. 2016;43(5):562-74. doi: 10.1111/apt.13523.
116. Roselli C.; Desideri D.; Rongoni A.; Saetta D.; Feduzi L. Radioactivity in coffee. J Radioanal Nucl Chem. 2012;295(3):1813-18. doi: 10.1007/s10967-012-2101-7.
117. Muriel P.; Arauz J. Coffee and liver health. In: Coffee. Chu Y-F, editor. Wiley-Blackwell: Oxford, UK; 2012. p. 123-39. doi: 10.1002/9781119949893.ch7.
118. Dasgupta A.; Klein K. Tea, coffee, and chocolate. In: Antioxidants in food, vitamins and supplements. Elsevier: San Diego; 2014. p. 237-57. doi: 10.1016/b978-0-12-405872-9.00013-6.
119. Folmer B.; Farah A.; Jones L.; Fogliano V. Human Wellbeing - Sociability, performance, and health. In: The craft and science of coffee. Folmer B, editor. Academic Press: 2017. p. 493-520. doi: 10.1016/b978-0-12-803520-7.00020-7.
120. Bae J.H.; Park J.H.; Im S.S.; Song D.K. Coffee and health. Integr Med Res. 2014;3(4):189-91. doi: 10.1016/j.imr.2014.08.002.
121. Sugiyama K.; Kuriyama S.; Tsuji I. Coffee consumption and mortality risk. In: Coffee. Chu Y-F, editor. Wiley-Blackwell: Oxford, UK; 2012. p. 211-26. doi: 10.1002/9781119949893.ch11.
Received: 21 March 2022 / Accepted: 27 july 2022 / Published:15 Agoust 2022
Citation: Portillo O R, Arévalo A C. Coffee's Phenolic Compounds. A general overview of the coffee fruit's phenolic composition. Revis Bionatura 2022;7(3) 31. http://dx.doi.org/10.21931/RB/2022.07.03.31